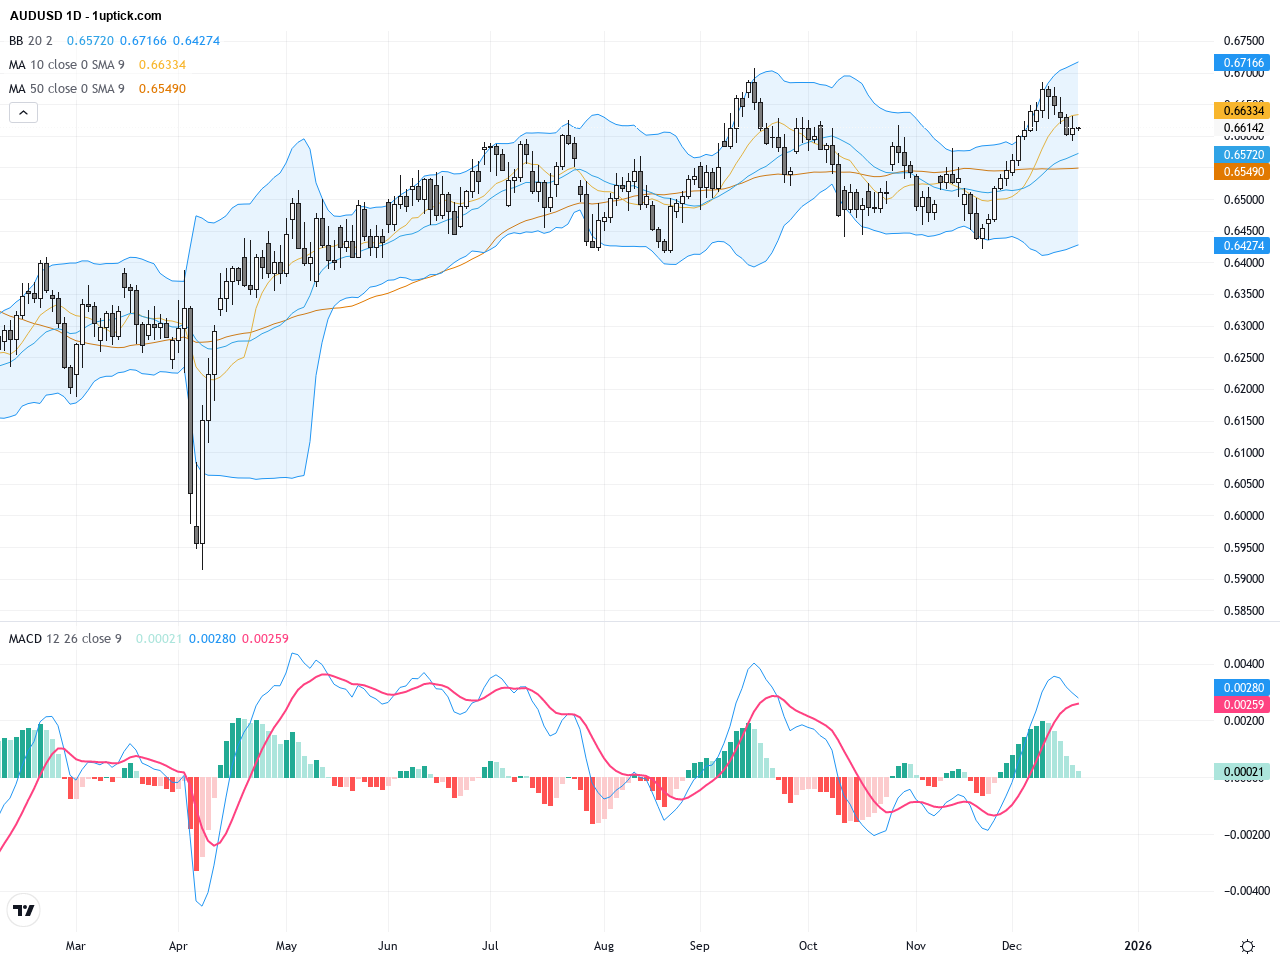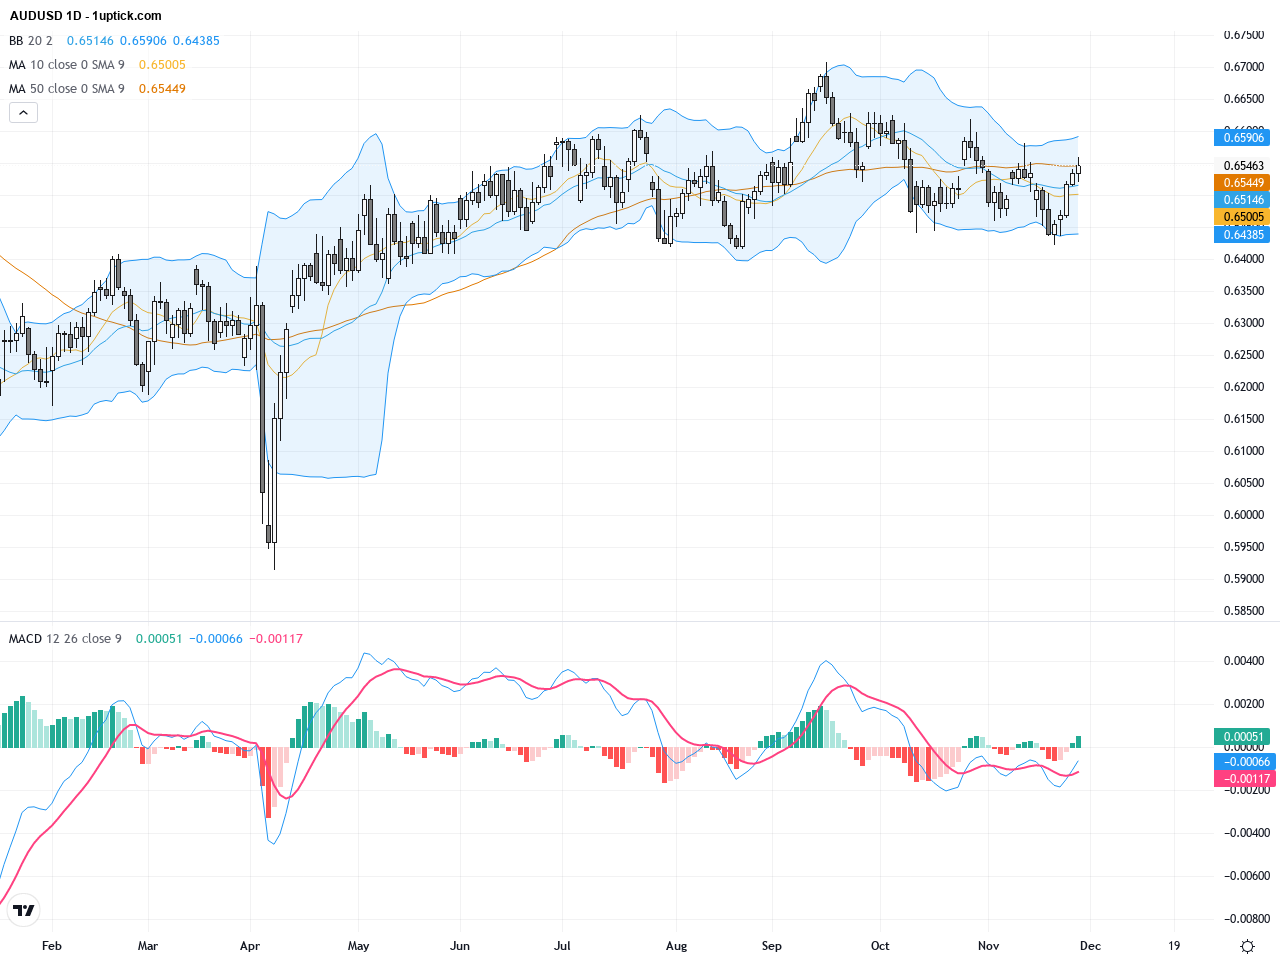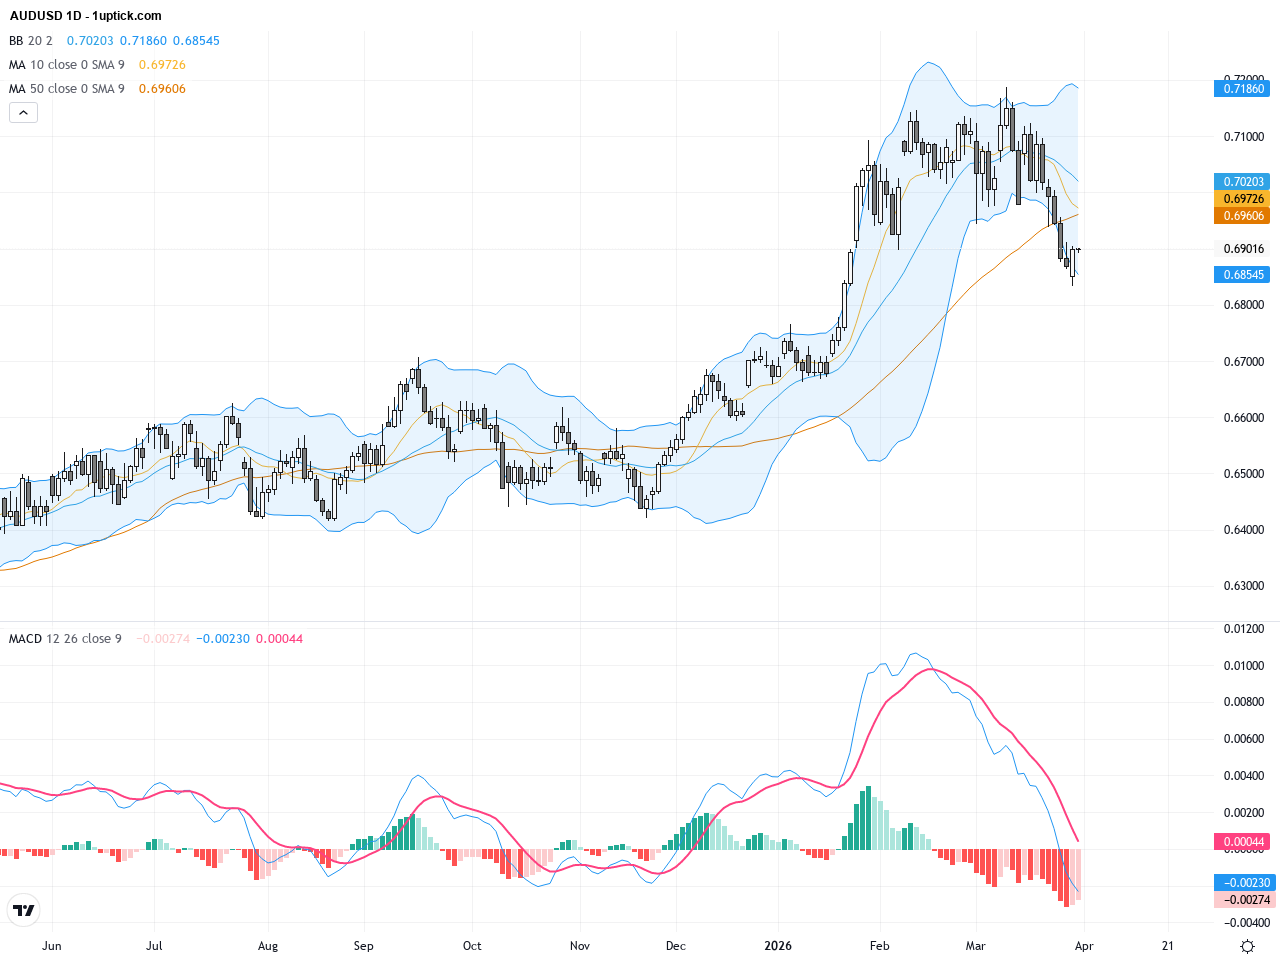
AUDUSD Technical Analysis: Key 0.6600 Support Holds as Crucial Patterns Signal Upcoming Volatility
Over the past three trading days, AUDUSD has displayed notable volatility hovering around the 0.6600 level, closing yesterday at 0.66122. The Australian Dollar tested a two-week low last session but managed to slightly recover, influenced by softer-than-expected US CPI data which capped gains. Fundamental forecasts from major Australian banks suggest stronger levels ahead, yet deteriorating global risk sentiment and disappointing Chinese economic data have restrained upside momentum. This week’s price action and market mood reflect cautious investor sentiment, with AUDUSD currently trading near a critical support zone. Traders should monitor how well this level holds and watch for potential technical breakouts. Overall, AUDUSD remains within a consolidation phase with increased volatility expected in the short term, advising close attention to both technical patterns and fundamental news for trade strategies.