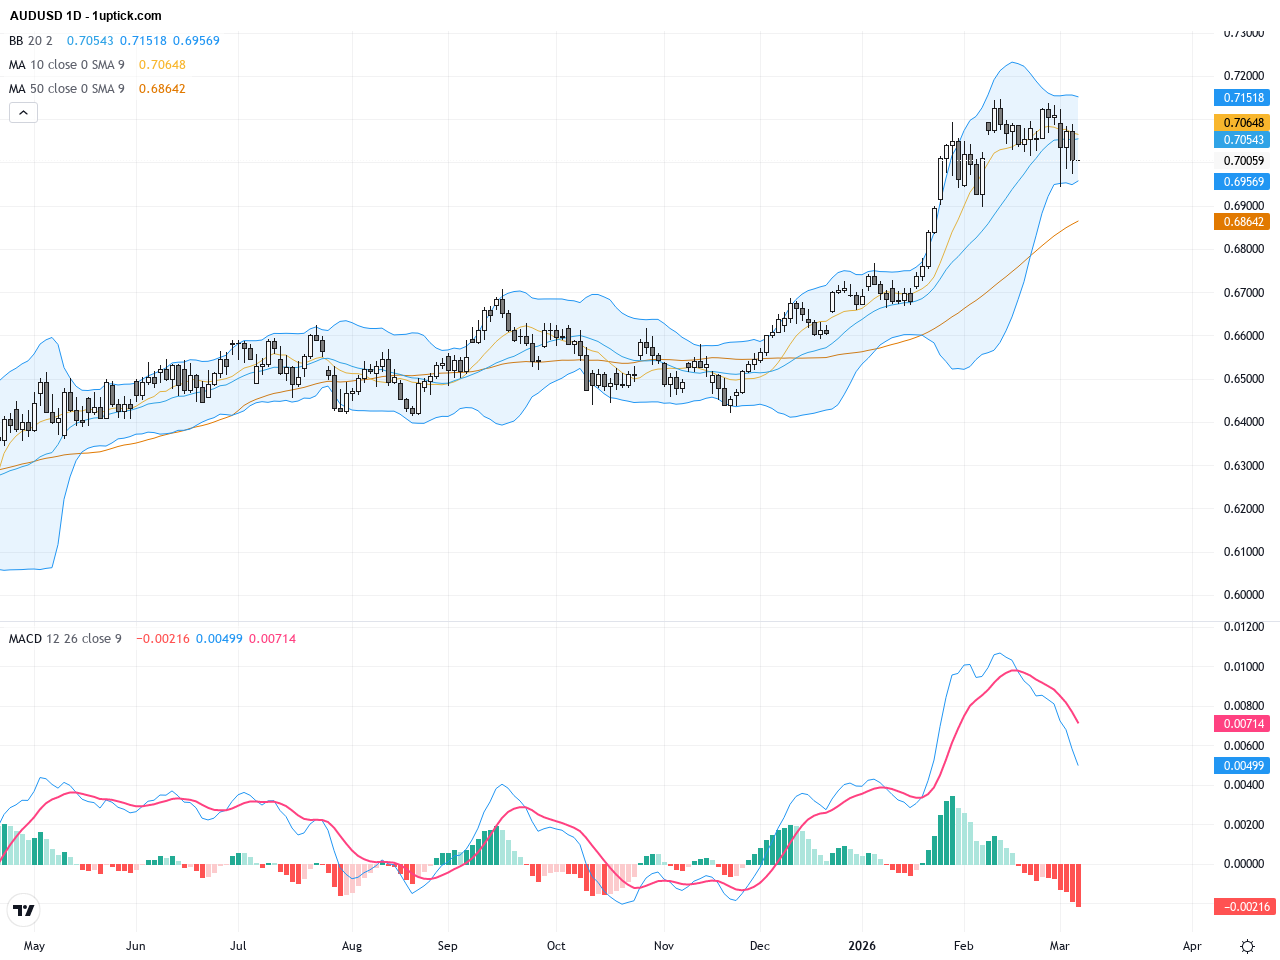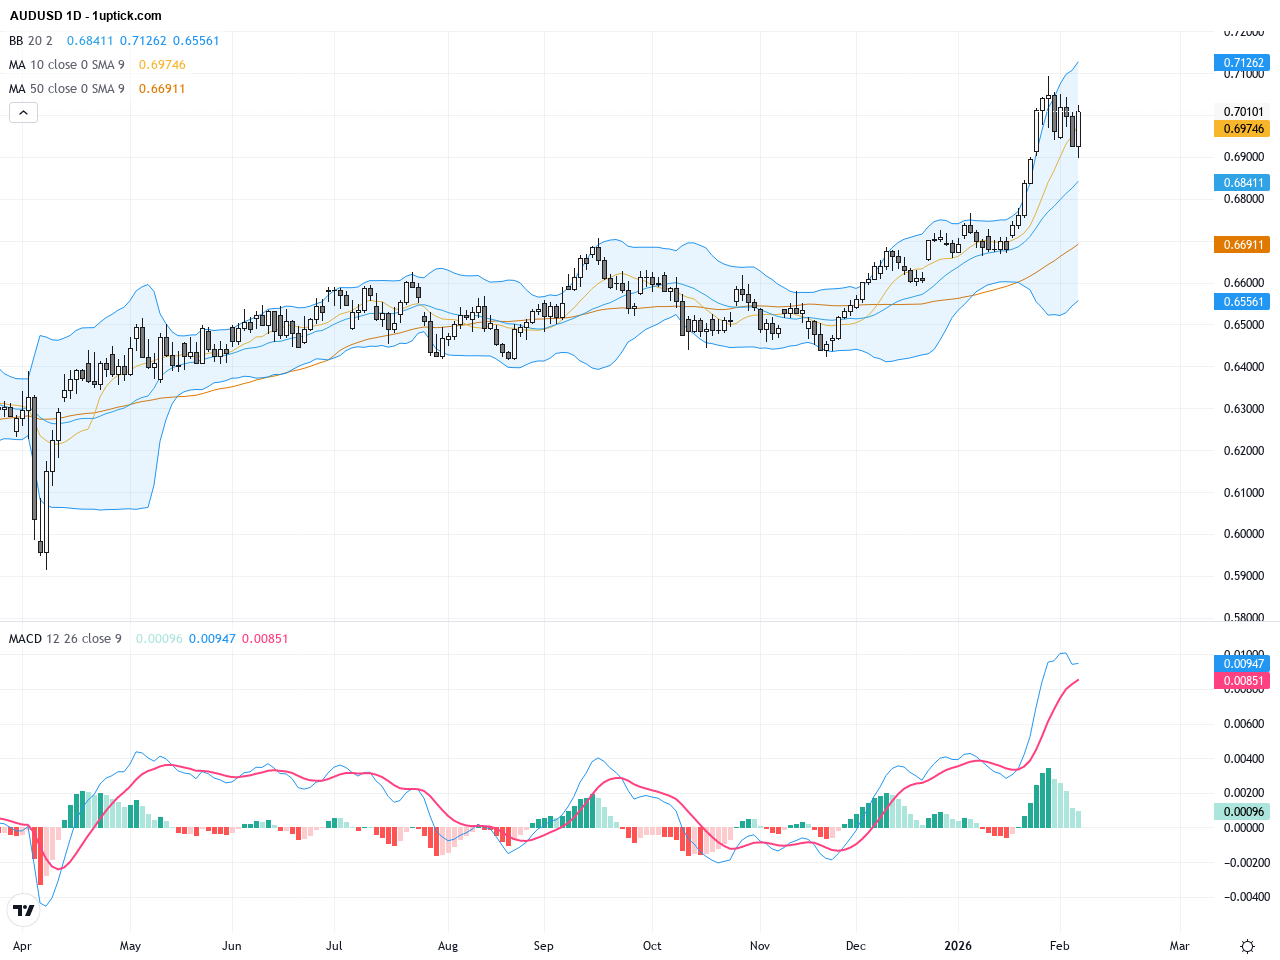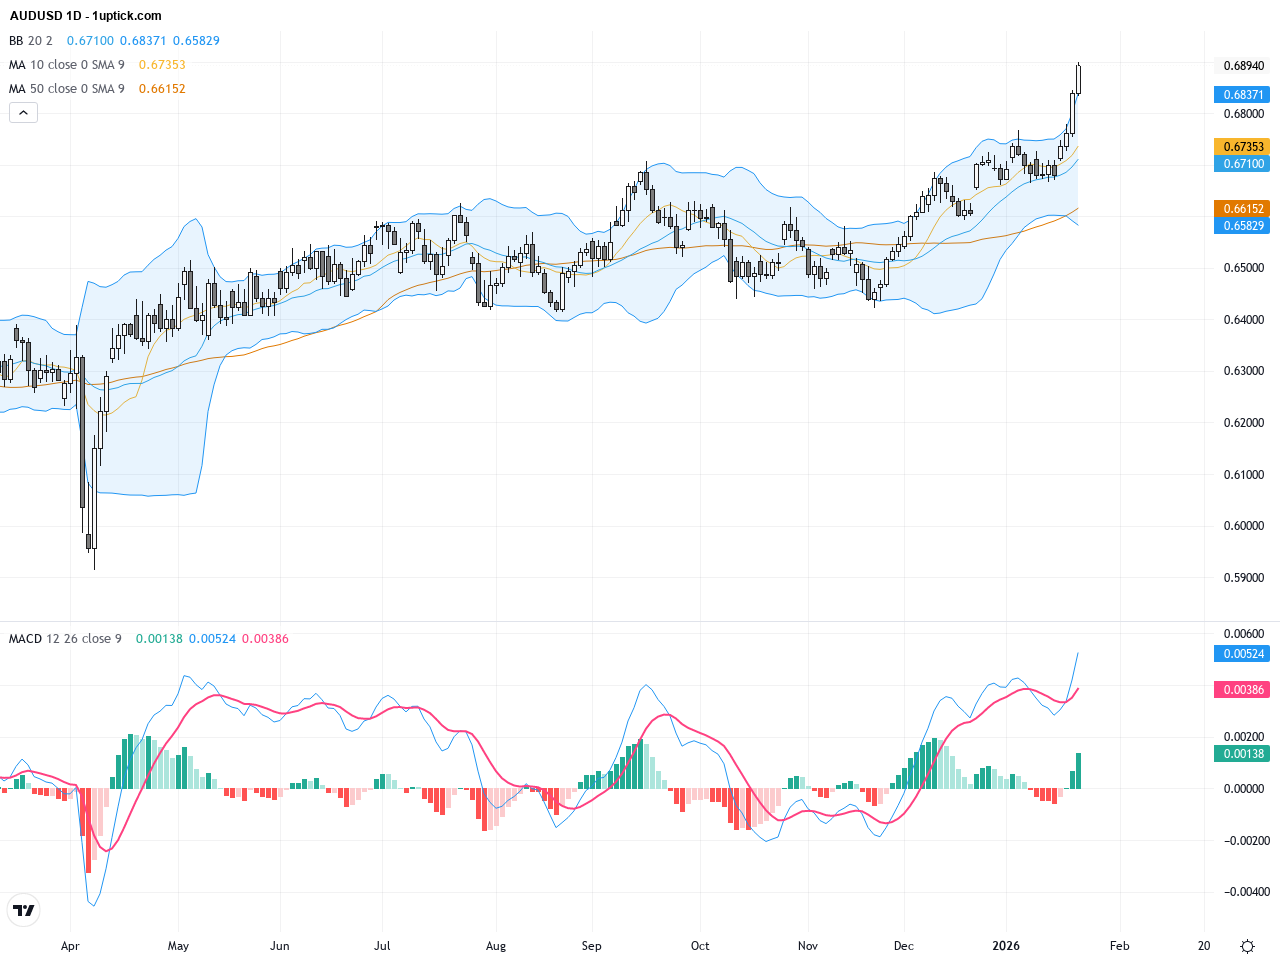
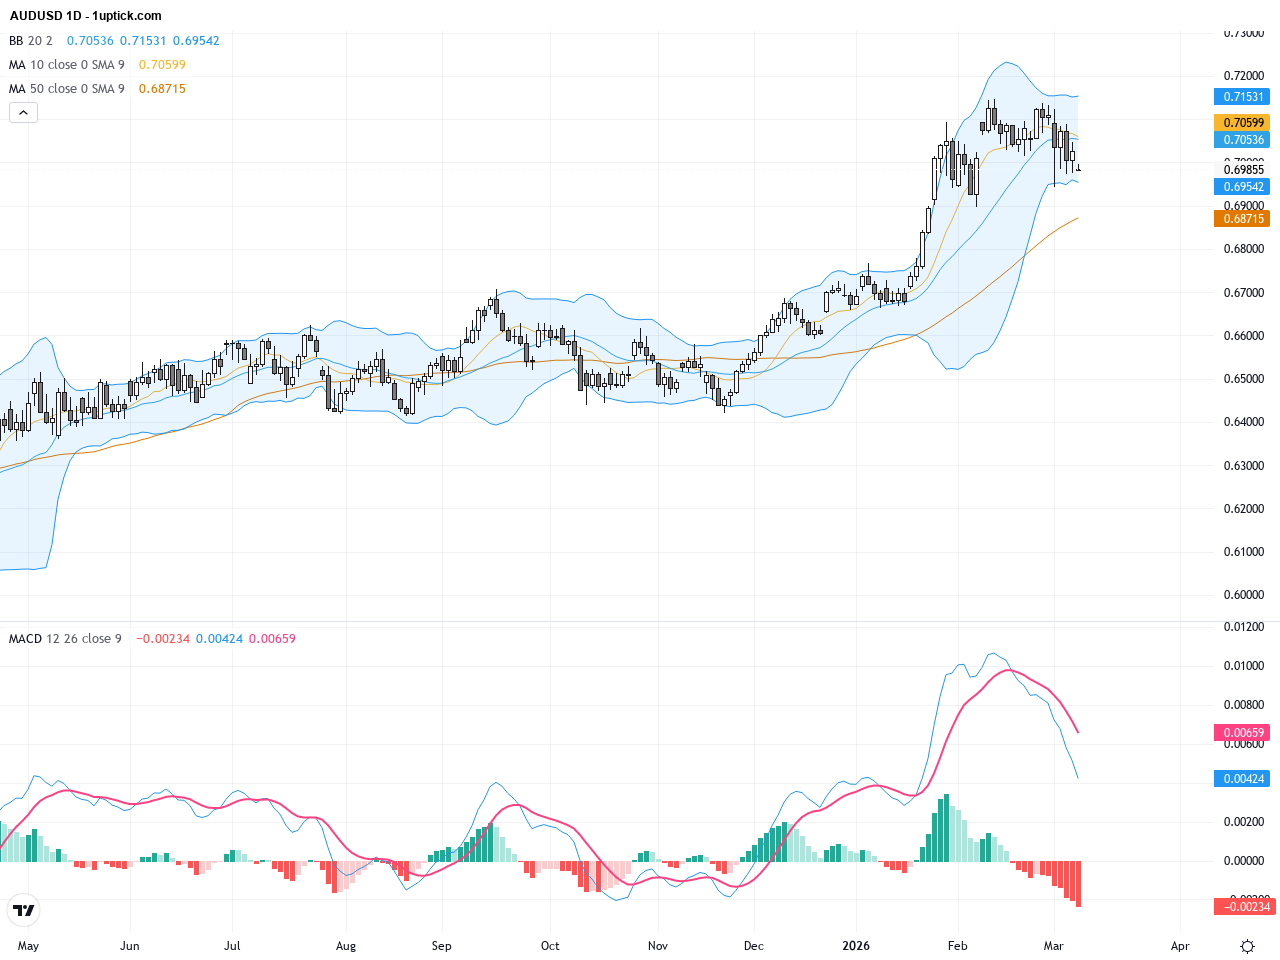
AUDUSD: Bullish Momentum Gathers Near Key 20-Day Moving Average Support
AUDUSD exhibited notable volatility over the past three trading days, closing yesterday at 0.69855, down approximately 0.29%. Despite solid Australian domestic economic data, escalating Middle East geopolitical tensions have injected uncertainty into the market, causing price fluctuations. Although options markets indicate increased downside risk, the spot AUD/USD pair remains firmly above the 0.70 level, suggesting limited selling pressure. For the average investor, this means that while risks exist, the Aussie dollar’s fundamentals remain intact, and patience is warranted until a clearer directional trend emerges. Technical analysis points to the 20-day moving average forming a short-term support base, potentially paving the way for further upside.