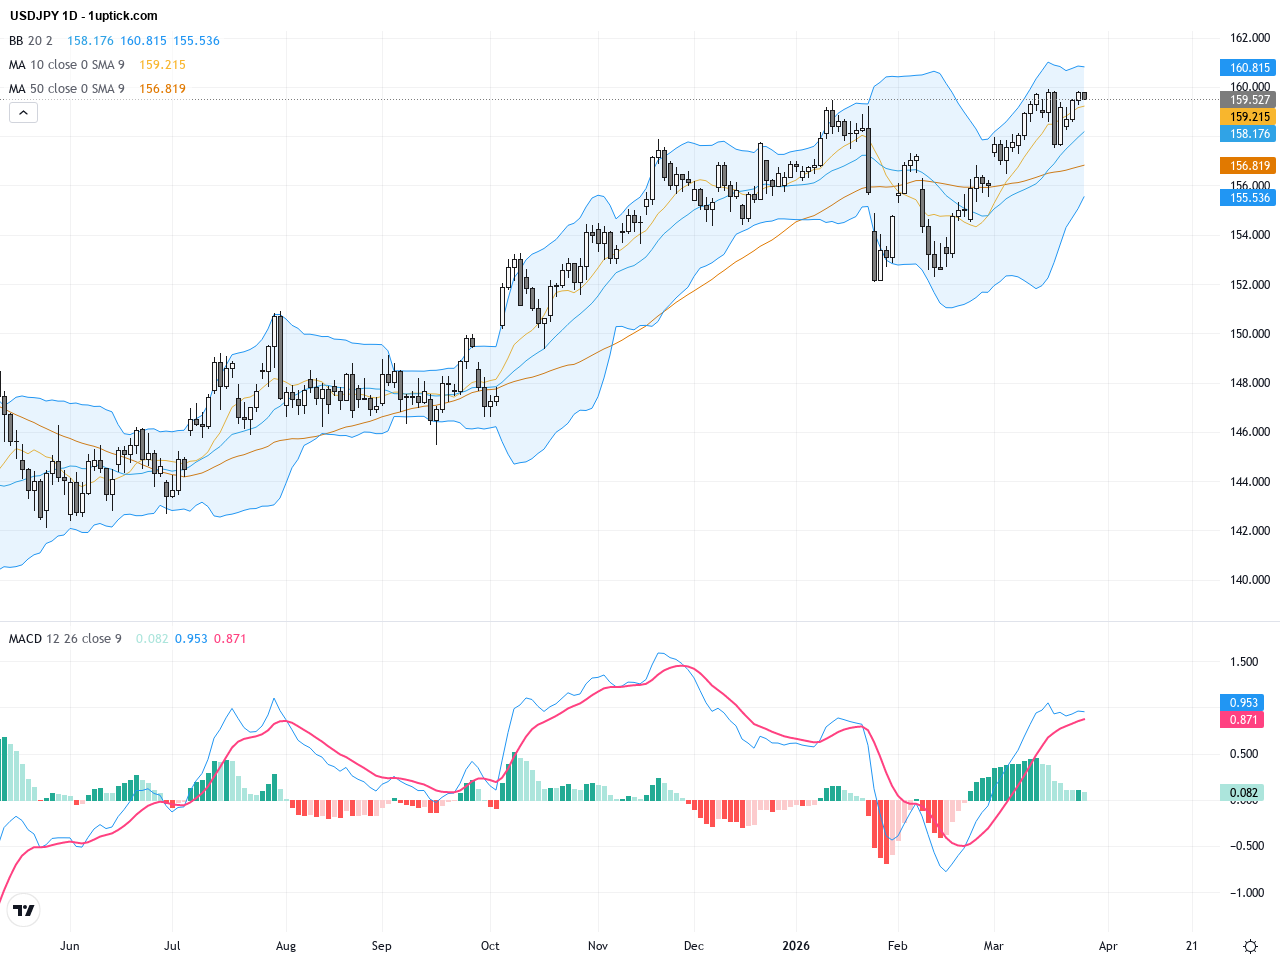
USDJPY: Approaching 160 Key Level as Oil Shock Fuels Yen Weakness Trading Outlook
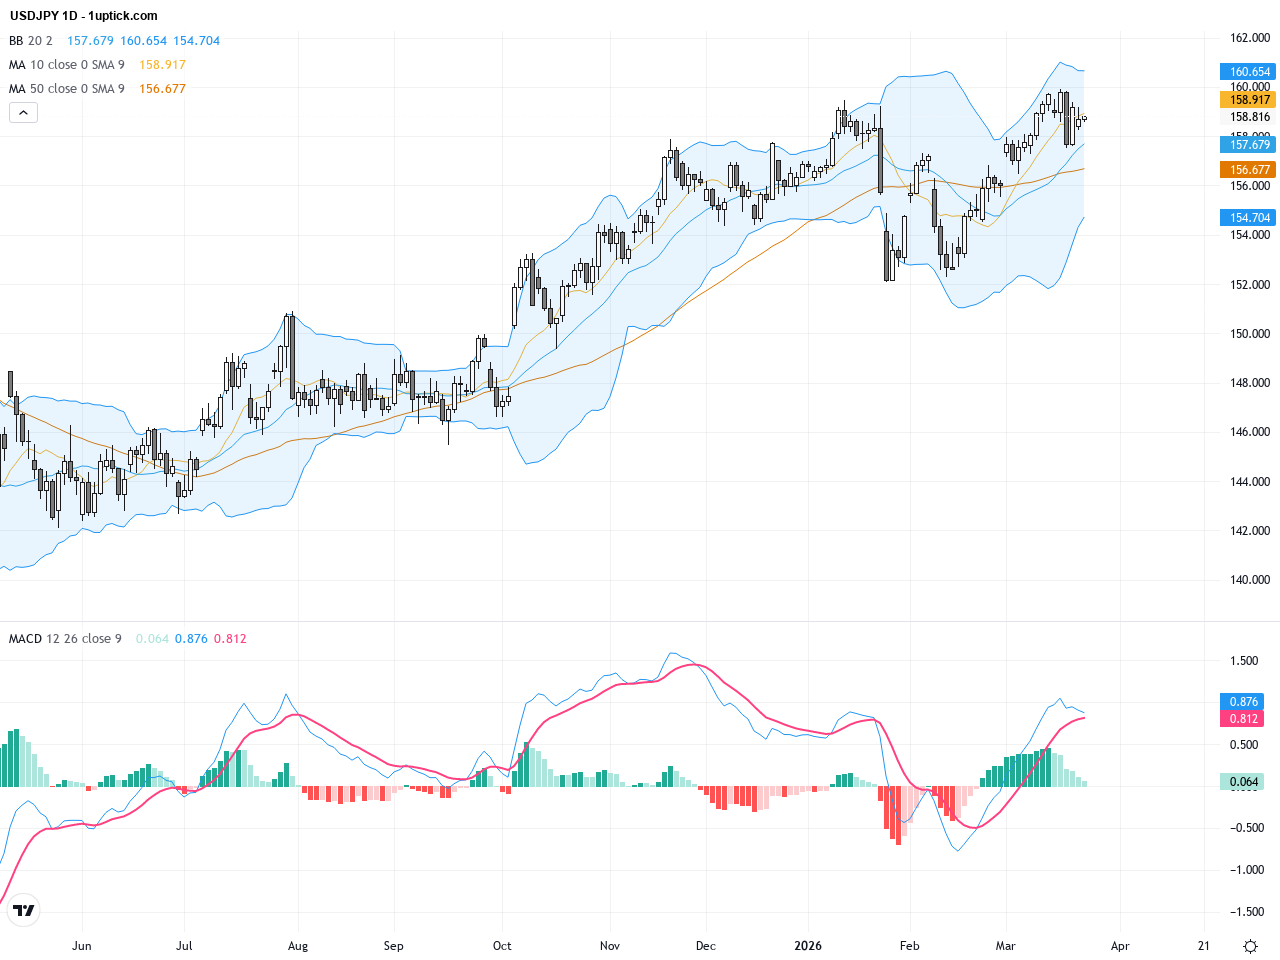
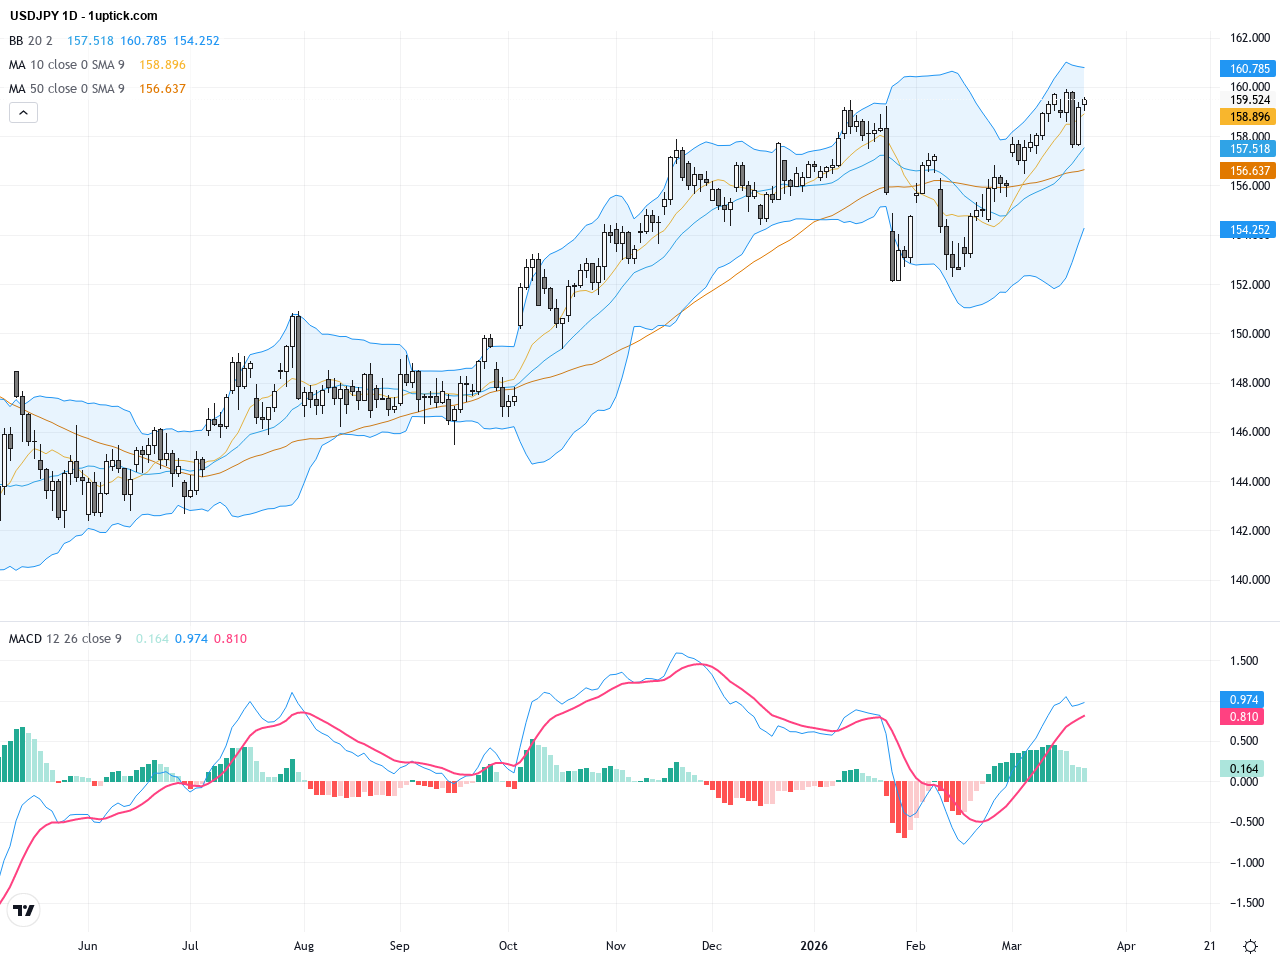
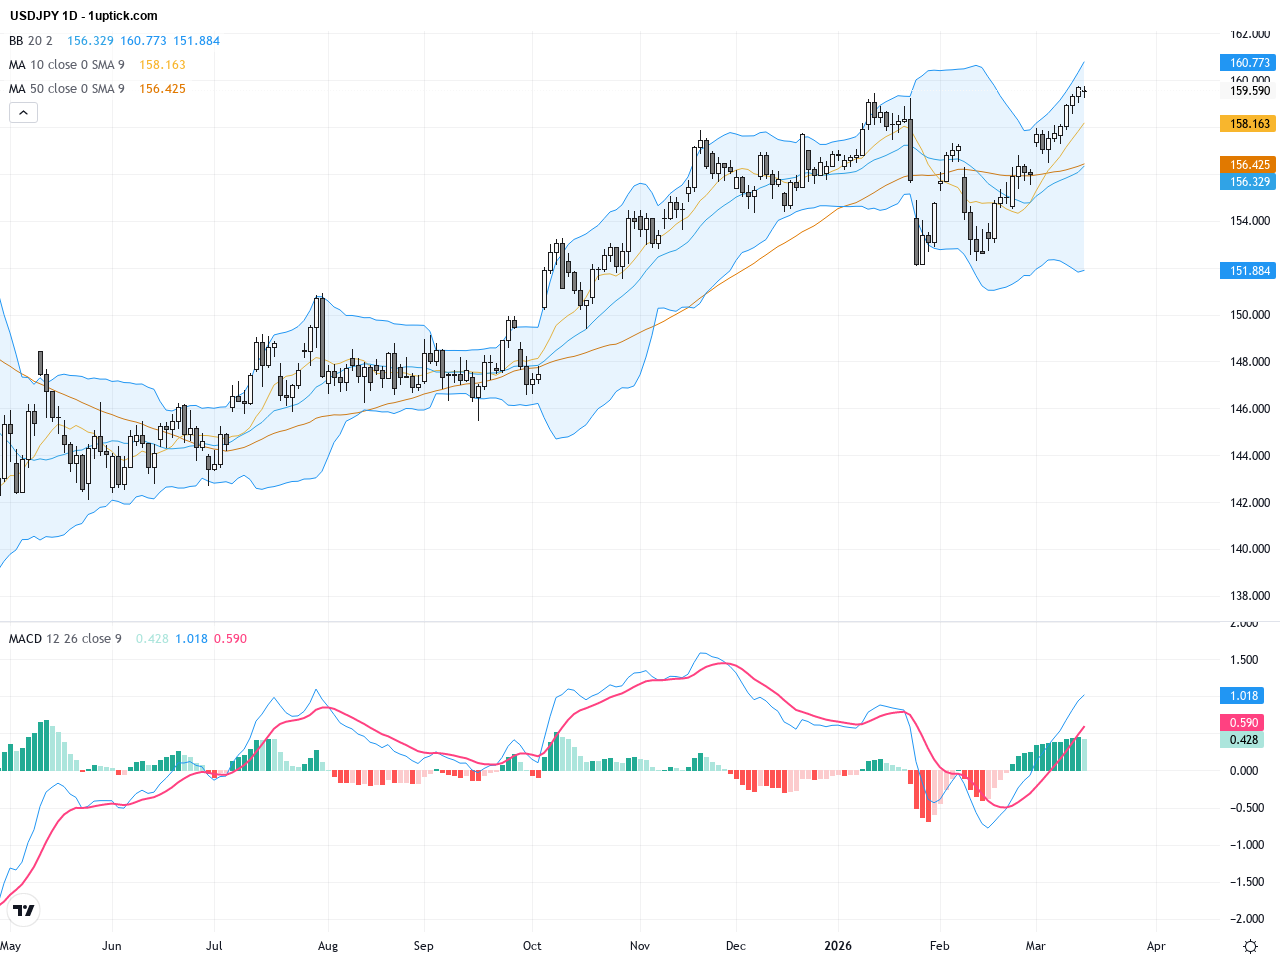
Over the past three trading days, USDJPY has trended higher amid escalating oil prices and geopolitical tensions in the Middle East, with yesterday’s close at 159.522 showing a slight pullback. The surge in oil prices has boosted safe-haven demand for the US dollar, driving the pair toward the critical psychological resistance at 160. Doubts over an Iran ceasefire further underpin the dollar’s strength, while Japan’s recent warnings about yen depreciation have yet to curb the momentum. For investors, this scenario highlights how commodity shocks and geopolitics intertwine to sway currency moves, emphasizing the need to monitor key support and resistance levels closely for trading opportunities.