
Month: September 2024

Gold Trend 30/09

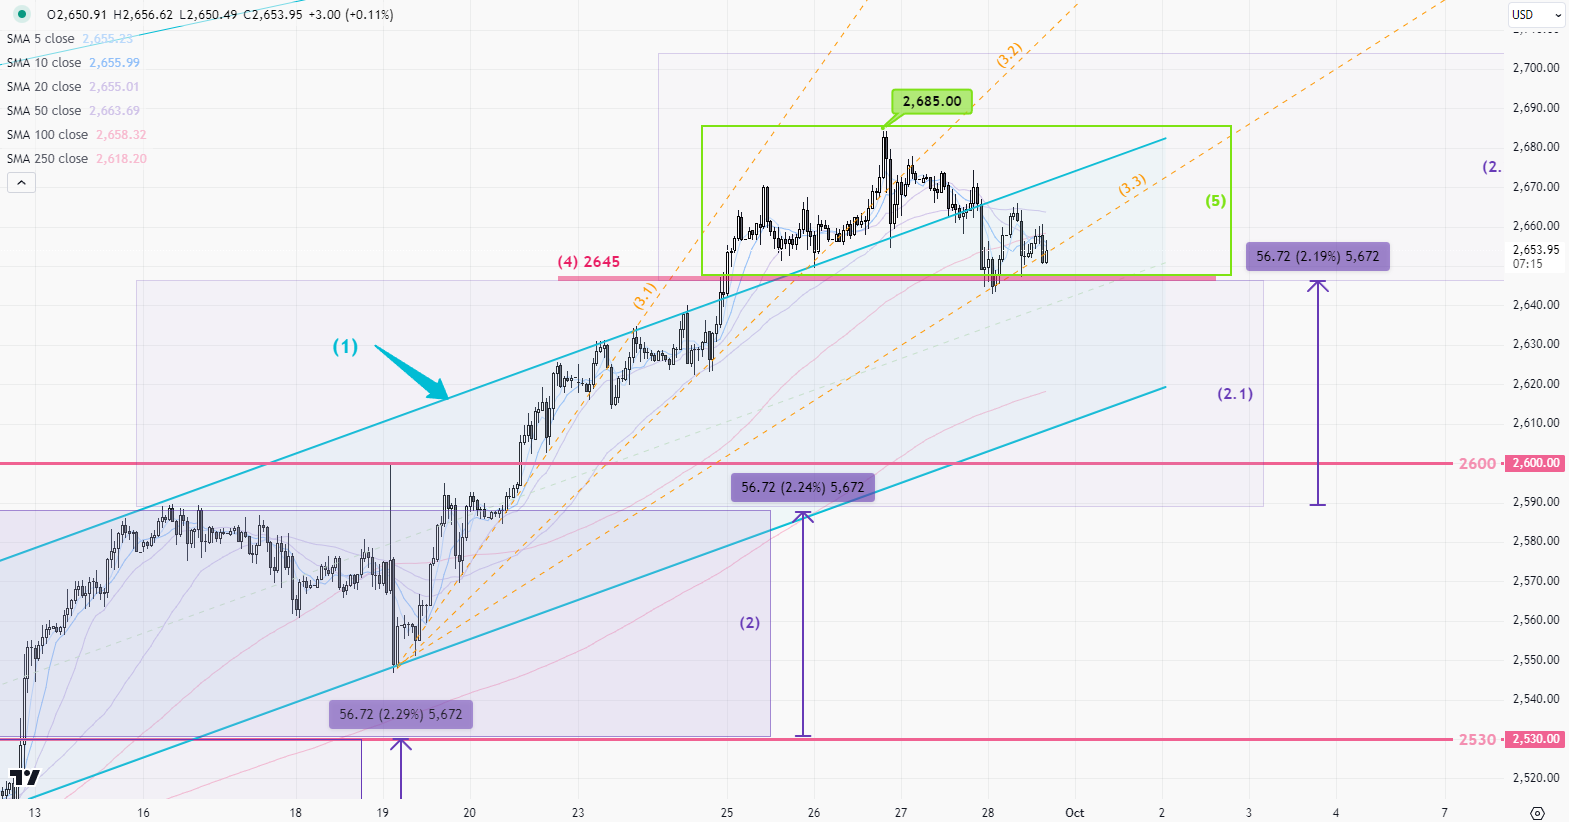
Carrying the upward trend from the week before, gold prices hit a new high, pricing in the US Fed. additional 0.25% rate cut last week, in line with our expectations. The current uptrend started from 2550 after the meeting, and the upward momentum has finally slowed down after reaching a peak at 2685 on Thursday. The latest OI data from CME showed some slight profit-taking in the market before the weekend.

After the US Fed. meeting and China’s recent economic stimulation policies, the market is still in a kind of excited state. The CME fed. watch indicates that the probability of a 0.5% rate cut in November has increased from 48% at the end of last week to the latest 54% today. As long as the upcoming U.S. economic data in the next few weeks remains “normal,” and in line with market expectations. The gold market should behave the same as in late Aug. and early Sept. with a backdrop of the market speculating another 0.5% rate cut at the next Nov. meeting,

The focus this week is on Friday’s U.S. employment data. If the data exceeds expectations, gold may give us a deeper correction.

>

1-hour Chart > Last week’s target of 2645-50, based on the sideway range 1:1 ratio(2), has been achieved, and the price continues to break higher. However, it is important to note that the upward trend began to slow down towards the end of last week, with the upward momentum slowing further from support line(3.1) to (3.2) and then to (3.3). The S-T operating range is between 2645-85(5) for now. The key support level is at 2645 (4), and if this level is breached towards the end of this week, the operating range will shift down to 2600-2645.

>

Daily Chart > 2685 appears to be the current top. Temporarily takes the high and low of last Thu. and Fri.(7) as a trading reference(7). If the price breaks below 2645, the support line (6) and the 20-day MA should be the downside target in the coming two weeks.

P. To
Gold Trend 23/09

The uptrend has restarted since the gold prices broke out from the range of 2480-2530(1) two weeks ago. There was some S-T profit-taking after the US Fed announcement, however, the prices managed to clear the S-T resistance(3) before the weekend, hitting a new all-time high.

Before the US Fed. meeting, the market was merely expecting a 25 basis points cut, and the extra 25 basis points cut surprised everyone. Now the market needs additional time to price in this new factor, so gold prices are likely to keep going up in the S-T. Recently, people are more focused on how the U.S. economy is doing rather than inflation figures. This week, keep an eye on the U.S. 2Q GDP report coming out on Thursday. The PCE inflation data on Friday might not have a very big impact on gold prices.

>

1-hr Chart(above) > Gold prices have been running in an uptrend channel(2) in the past two weeks. While the price is hanging around its recent highs, there are no previous supports or resistances to reference from. However, remember the gold has been trading sideways between 2472-2530(4) in early September. Seems that each break-out is running the same range, around 56 dollars. After surpassing (4.1) last Friday, the first target for this week could be set at approximately 2646-50 (4.2), 1:1 ratio.

>

Daily Chart(above) > The upward momentum of gold prices is accelerating, and the upward support has shifted from (5) to (5.1). There is no obvious reversal signal on the daily chart, the buy-low strategy continues.

P. To

Gold Trend 09/09

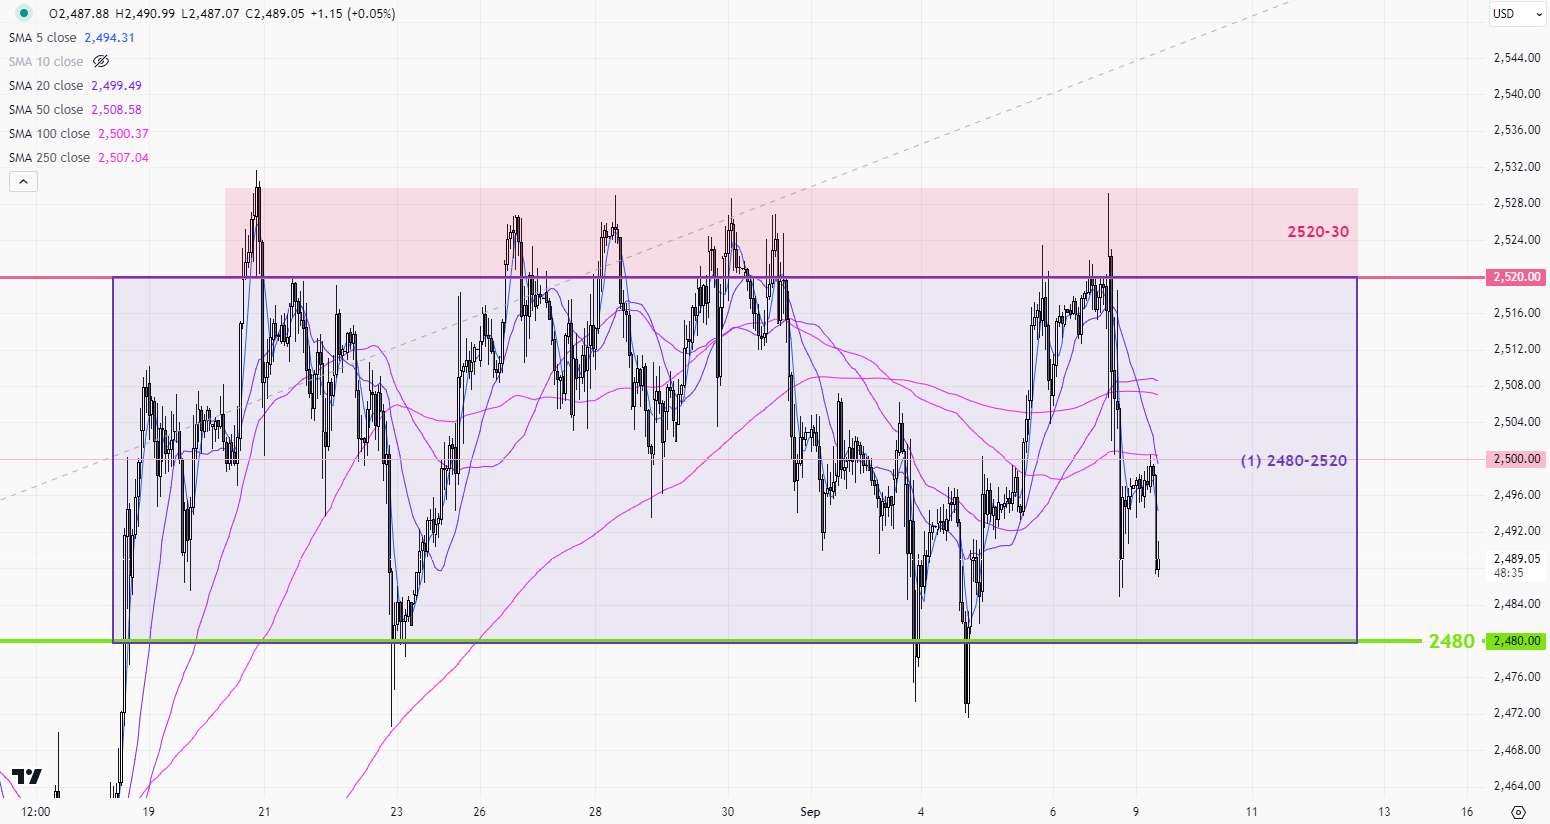
Spot gold price has remained sideway in the past 2 weeks, with both the PCE price index and US employment data failing to bring new momentum to the market. The OI data from CME’s gold futures has stayed at around 510k for a while now, showing no significant changes in the numbers of long/short positions. This week’s focus is on Wednesday’s U.S. inflation data, no matter if it is good or bad, the market reaction should be like those major figures released previously. A week from the US interest rate meeting, it’s not easy for gold to escape the current range without any new stimulus. The market should give us more chances this week to take advantage of the sideways market. Just need to be cautious towards the end of this week, when the market may start to price-in further the US Fed. cut next week, leading to an early breakthrough.

>

1-hr chart > Continue to operate in the 2480-2520(1) range until the price escape.

>

Daily chart > The uptrend channel (2) is still dominating the gold market in M-T. S-T range remains in 2480-2530(3). If the price falls below 2480 before/after the Fed. meeting, a major consolidation will begin. a

P. To

1uptick Analytics @

Risk Warning​

*Investment involves risk. You may use the information, strategies and trading signals on this website for academic and reference purposes at your own discretion. 1uptick cannot and does not guarantee that any current or future buy or sell comments and messages posted on this website/app will be profitable. Past performance is not necessarily indicative of future performance. It is impossible for 1uptick to make such guarantees and users should not make such assumptions. Readers should seek independent professional advice before executing a transaction. 1uptick will not solicit any subscribers or visitors to execute any transactions, and you are responsible for all executed transactions.

© 2022-26 1uptick Analytics all rights reserved.


Risk Warning​

*Investment involves risk. You may use the information, strategies and trading signals on this website for academic and reference purposes at your own discretion. 1uptick cannot and does not guarantee that any current or future buy or sell comments and messages posted on this website/app will be profitable. Past performance is not necessarily indicative of future performance. It is impossible for 1uptick to make such guarantees and users should not make such assumptions. Readers should seek independent professional advice before executing a transaction. 1uptick will not solicit any subscribers or visitors to execute any transactions, and you are responsible for all executed transactions.

© 1uptick Analytics all rights reserved.

Home
.AI
Analysis
Calendar
Tools
