2025-08-25 @ 14:00
Gold price in August 2025 is poised for dynamic movements influenced by key macroeconomic factors and technical indicators. Despite recent all-time highs, signals point toward possible corrections as gold, silver, and mining stocks reflect behavior similar to their 2011 peaks. The strong US dollar and stabilizing tariff conditions are expected to exert downward pressure on gold prices in the near term. However, longer-term outlook remains optimistic with gold showing substantial gains over the past year, driven by ongoing market volatility and safe-haven demand. Traders should watch critical technical levels around $3,410 for bullish or bearish confirmation and consider profit targets aligned with current market trends. Strategic positioning based on both fundamental factors like USD strength and technical signals is essential for maximizing returns in this fluctuating gold market.
2025-08-25 @ 13:14
Gold and silver prices are rising as investors anticipate potential Federal Reserve rate cuts amidst economic slowdowns. The price surge is driven by expectations of monetary policy adjustments, boosting demand for precious metals as safer investments.
2025-08-25 @ 13:12
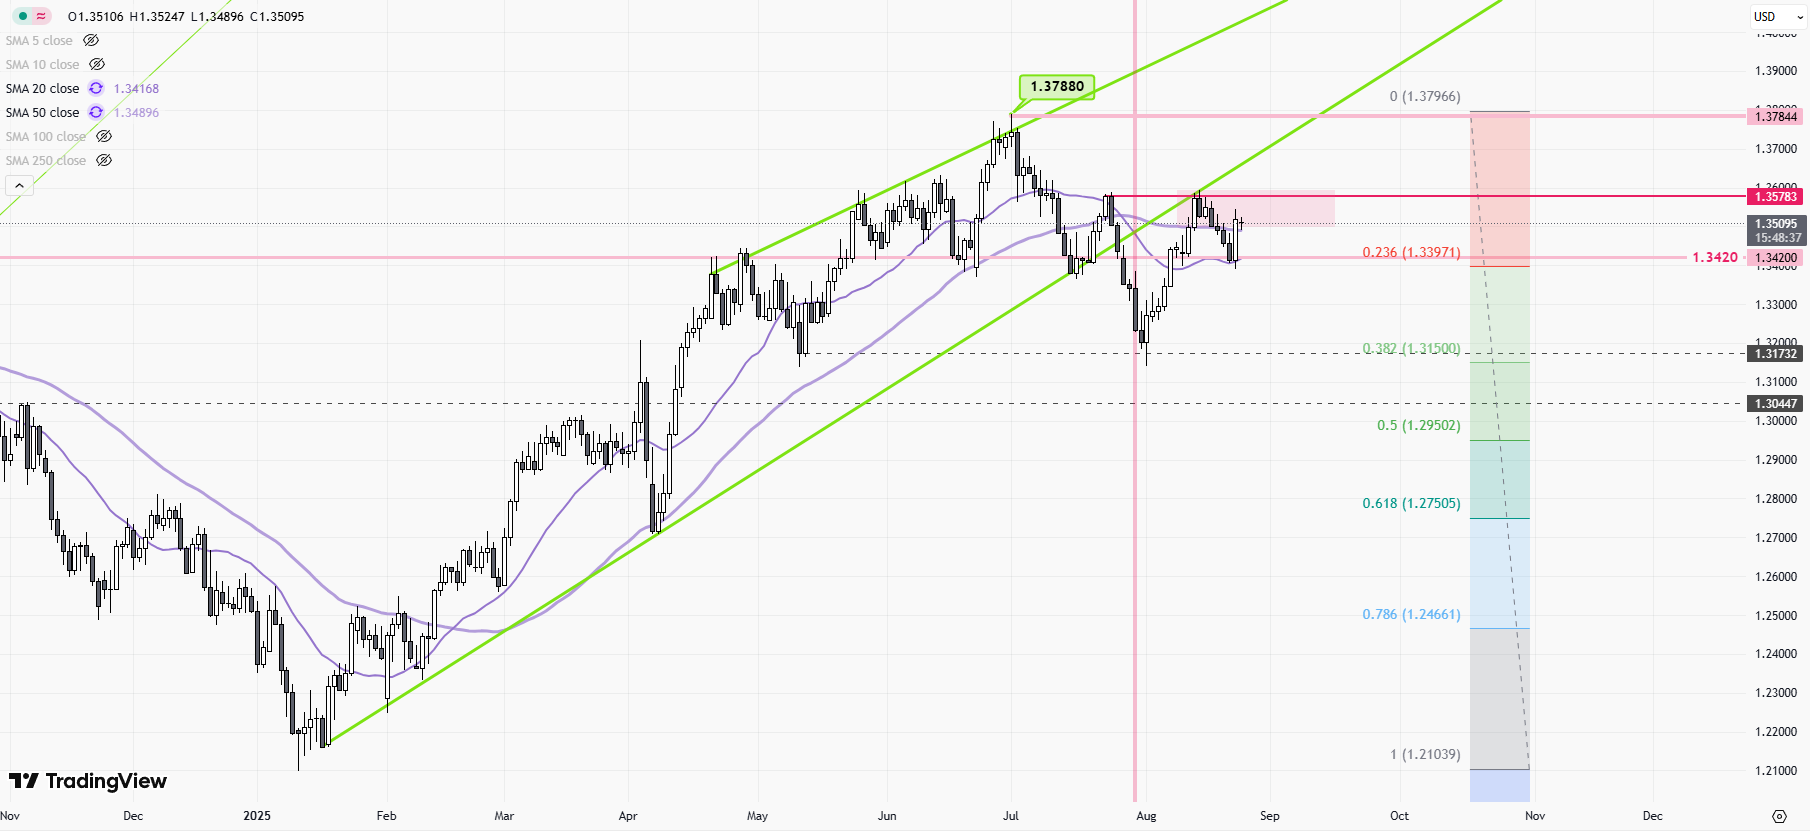
GBP/USD experienced notable volatility over the past week, initially dipping to lows near 1.3390 before rebounding and ending the week around 1.3527. This movement was driven by a mix of UK economic data, including softening domestic demand and persistent concerns about the labor market, which fueled speculation of earlier Bank of England rate cuts. Meanwhile, declining inflation and cautious consumer sentiment weighed on the pound’s appeal. The dollar’s strength was supported by resilient US data and Federal Reserve communication suggesting restrictive policy. However, a sudden surge in GBP/USD occurred after Fed Chairman Powell indicated a potential US rate cut in September, swiftly shifting sentiment and boosting sterling against the greenback. Overall, GBP/USD remains sensitive to central bank policy signals and evolving inflation figures as traders adjust positions on shifting interest rate expectations.
2025-08-25 @ 13:08
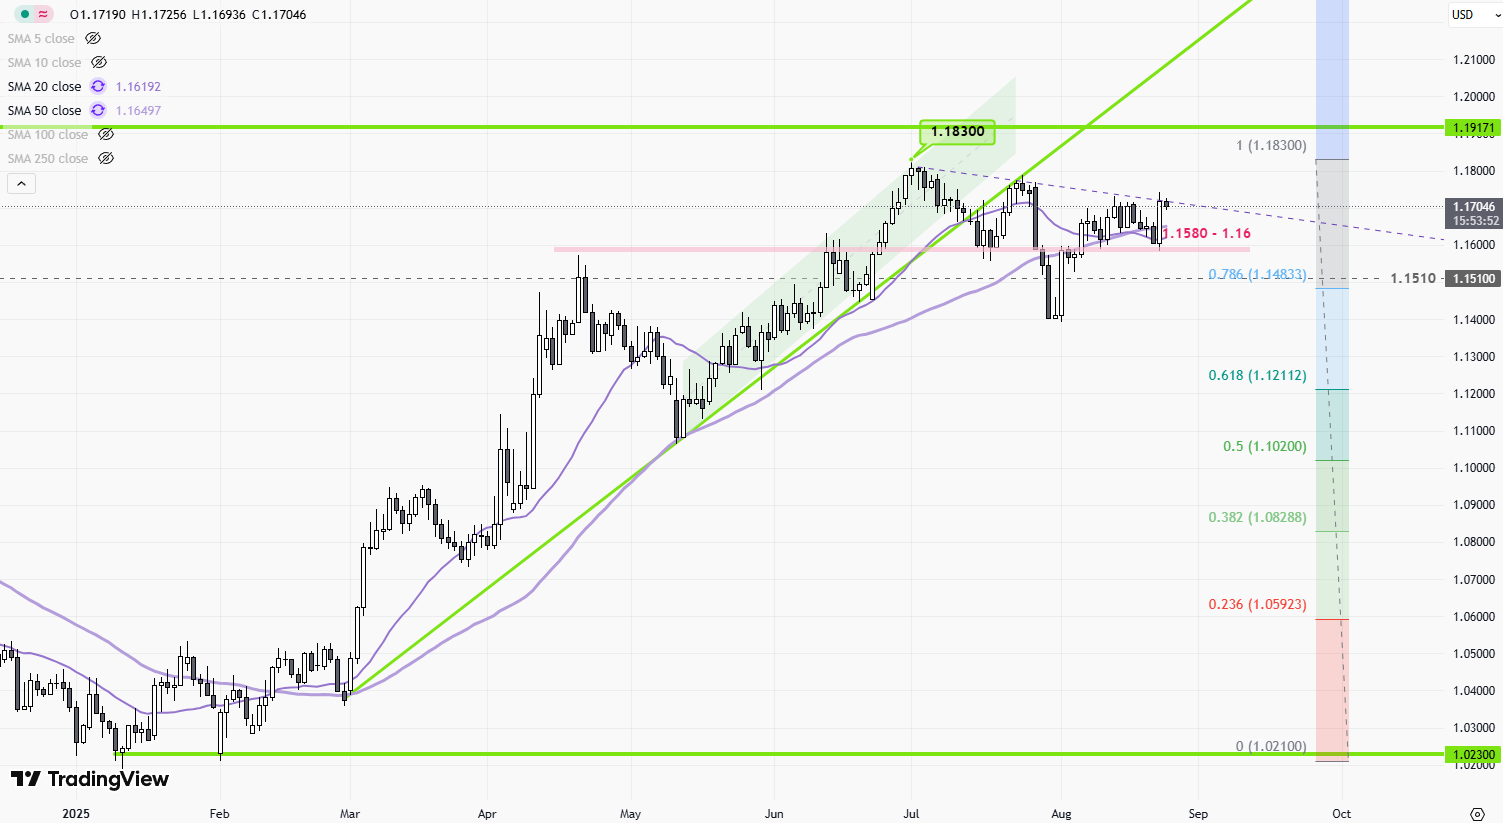
EURUSD traded in a volatile range over the past week, finding support near 1.1630 and rebounding toward 1.1670. The main drivers were expectations of imminent Fed rate cuts, especially after dovish comments from Fed Chair Powell, which weakened the US dollar and triggered sharp swings. Mixed US inflation data and signs of slowing economic momentum contributed to the dollar’s softness. On the euro side, stable risk sentiment and signs of stabilization in external demand helped limit downside, even as European growth data remained mixed. Geopolitical developments, including renewed diplomatic efforts in Ukraine and easing energy prices, also supported the euro. Despite prevailing downward technical signals, the pair showed resilience above key support levels, suggesting further upside potential if US data confirms expectations of monetary easing.
2025-08-23 @ 00:03
Gold prices in August 2025 are hovering near record highs, but technical analysis indicates potential resistance and a pullback amid ongoing economic uncertainty. Recent market behavior mirrors the 2011 peak conditions for gold, silver, and mining stocks, with major gold stock ETFs reaching critical resistance levels. The US dollar is strengthening due to stabilizing tariffs and a shift in market dynamics, which could pressure gold prices downward in the short term. Momentum indicators show bearish signals and a possible downward correction from current highs, despite an overall bullish bias remaining intact above key support levels near $2,340. Market participants are closely watching upcoming Federal Reserve policy signals and geopolitical developments, which will likely influence gold price direction in the near future. Traders should consider both support and resistance zones carefully as gold navigates these technical and fundamental factors.
2025-08-22 @ 19:00
Gold and silver prices in August 2025 are poised for notable volatility influenced by key market drivers, including significant events like the Jackson Hole symposium. Gold recently hit new all-time highs, mirroring patterns from 2011, while silver is forecasted to stay in the $26 to $30 range. Strong USD performance, tariff developments, and technical signals suggest a potential near-term correction for gold despite bullish forecasts from major financial institutions predicting prices up to $3,700 or higher by year-end. Silver is expected to see moderate gains with fluctuations as market sentiment evolves. Investors should watch the unfolding economic indicators and geopolitical factors around the Jackson Hole event to navigate this dynamic precious metals landscape effectively.
2025-08-22 @ 14:00
Gold prices are hovering near record highs in August 2025, driven by a combination of market dynamics and economic factors that could influence the next significant move. Despite recent peaks, technical signals suggest a potential pullback as gold futures show early signs of decline. Key influences include resistance levels reached by gold mining stocks, strength in the US dollar following tariff stability, and patterns reminiscent of the 2011 market top. While gold remains a strong hedge against inflation with forecasts anticipating continued volatility, investors should watch for shifts in economic indicators and geopolitical developments that could impact prices in the coming weeks. Stay informed on gold trends to optimize investment strategies in this evolving market.
2025-08-22 @ 00:00
Gold prices are currently under pressure near the $3,310 level ahead of the Jackson Hole Symposium, influenced by a strengthening US dollar and ongoing geopolitical shifts. Despite recent all-time highs, technical indicators suggest a potential pullback in gold futures as the US dollar index shows signs of a medium-term breakout, supported by stabilizing tariff policies and shifting global trade dynamics. Market analysts highlight that these factors could weigh on gold’s momentum in the near term, even as geopolitical tensions and inflation concerns maintain underlying support for the precious metal. Investors are closely watching upcoming economic events and geopolitical developments that will shape gold price trends in the coming weeks.
2025-08-21 @ 19:00
Gold is currently forming a new symmetrical triangle pattern near $3,430, signaling a potential major breakout that could push prices toward the $3,600–$3,700 range. This technical setup reflects a consolidation phase where prices pause before resuming a strong upward trend, supported by a history of consistent symmetrical triangle formations and bullish breakouts since late 2023. The pattern indicates growing bullish momentum for gold, suggesting continued strength in the market, although failure to break resistance might lead to a temporary correction. Traders watch for a decisive breakout confirmed by strong bullish candles to capitalize on this potential upward move. This formation aligns with broader long-term bullish trends driven by key technical patterns, positioning gold for significant gains ahead.
2025-08-21 @ 16:39
The USD/CAD currency pair rose sharply over the past week, climbing above 1.38 and reaching 1.3882 by August 21, 2025, reflecting continued weakness in the Canadian dollar. The move was driven by rising expectations of a Bank of Canada rate cut after recent weak inflation data, coupled with July’s unexpected labor market losses in Canada. Meanwhile, U.S. dollar strength persisted due to market uncertainty about the Federal Reserve’s policy direction, with investors focusing on upcoming Fed commentary and the possibility of renewed monetary easing. Persistent U.S. tariffs, economic divergences, and technical momentum above key resistance levels also contributed to the bullish trend in USD/CAD. Despite short-term volatility, the outlook remains sensitive to central bank actions, economic data, and geopolitical developments.