








 |
| Gold V.1.3.1 signal Telegram Channel (English) |
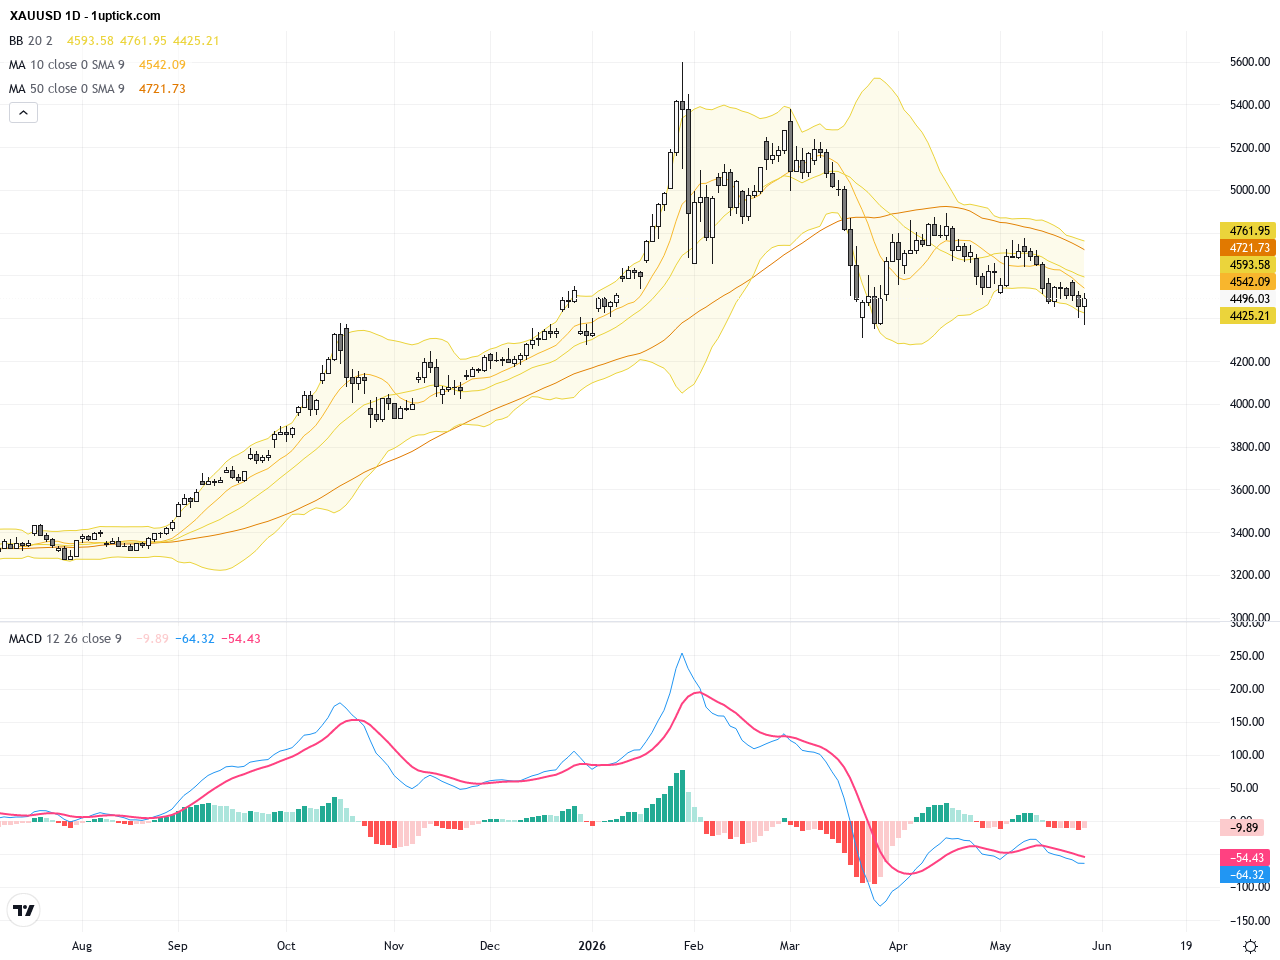
XAUUSD Gold: Bullish Reversal at 200-Day MA Highlights Key Support and Trading Outlook, May 29, 2026
2026-05-29 @ 05:04
Over the past 24 to 48 hours, gold (XAUUSD) has experienced significant volatility, with yesterday’s closing price at 4495.765 USD. The price action this week has been notably influenced by the latest weak GDP data, which sparked a bullish reversal that found support around the 200-day moving average.
Recent market news highlights that the weak U.S. GDP figures combined with technical support at the 200-day MA prompted a sharp rebound in gold prices, reviving optimistic sentiment among investors. Meanwhile, firmer U.S. dollar strength and rising yields exerted downward pressure on gold, pushing it to a two-month low at one point, reflecting ongoing concerns about dollar dominance and Federal Reserve rate hike expectations. This interplay of opposing forces is driving gold to seek equilibrium amid heightened volatility.
For everyday investors, this recent movement illustrates gold’s complex role as a safe haven: it tends to attract capital when economic data disappoints, reinforcing its value preservation appeal. Yet, a strong dollar and higher yields embolden risk appetite, weighing on gold’s attractiveness. Investors need to monitor macroeconomic data releases, monetary policy signals, and geopolitical developments closely, as these factors will continue to shape gold’s price trajectory and investment strategies in the near term.
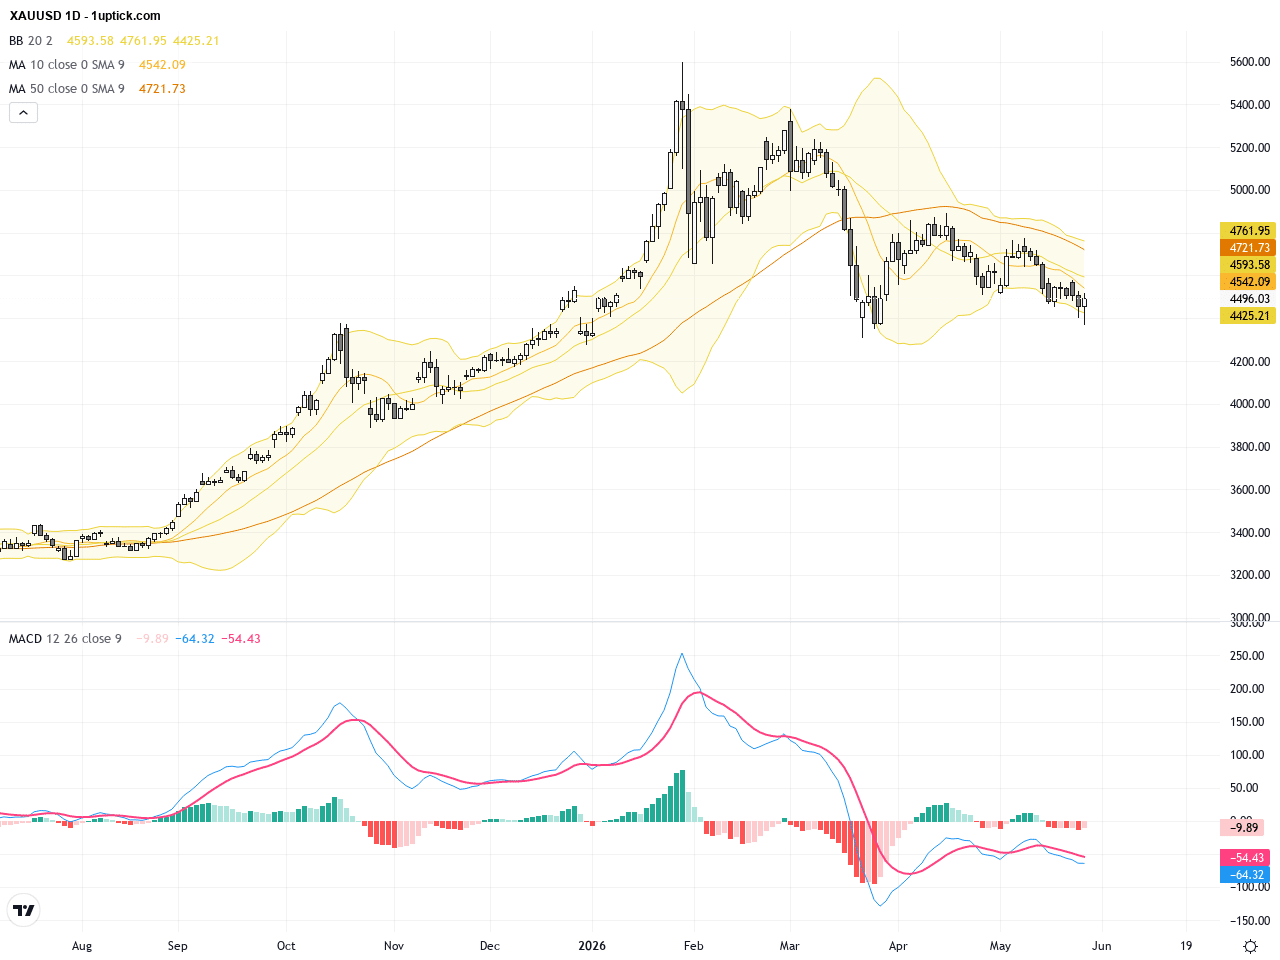
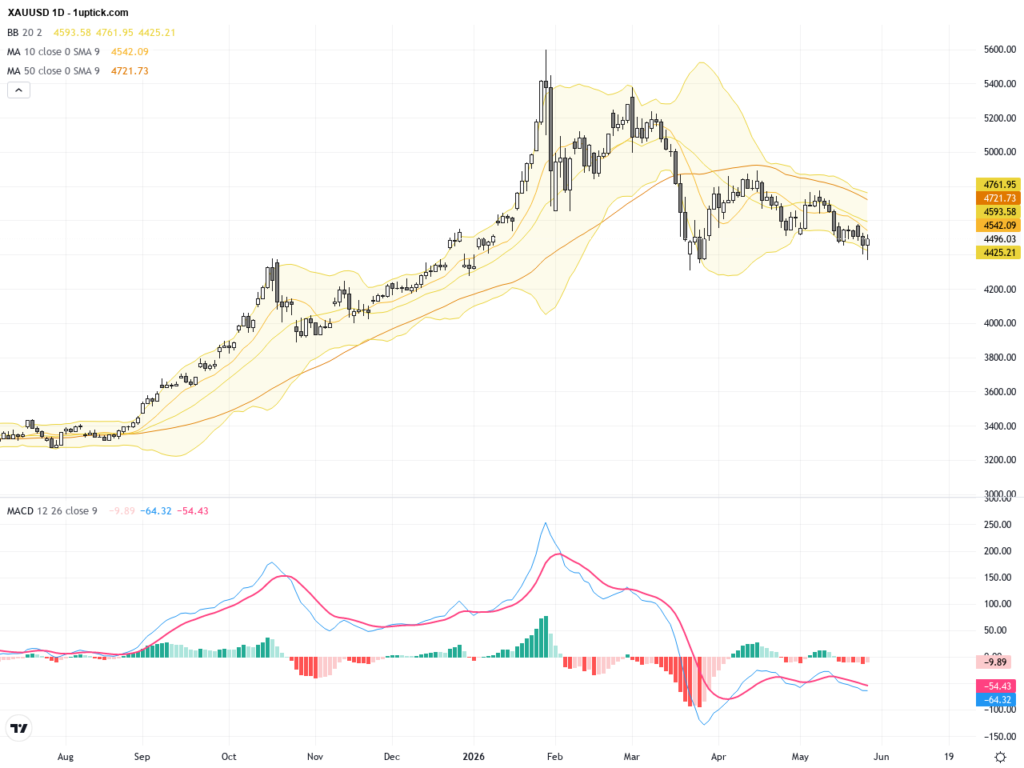
The daily chart shows that XAUUSD declined from highs near 4570 towards lows around 4366, reflecting a period of consolidation and correction. The 200-day moving average has acted as a critical support level, with recent price action rebounding sharply from this area. Bollinger Bands indicate the price touched the lower band, suggesting a rebound is underway. The MACD is below zero but exhibiting an upward turn, hinting at a potential medium-term bullish shift. Overall, the daily trend remains consolidative with a slight bullish bias focused on the 200-day MA support.
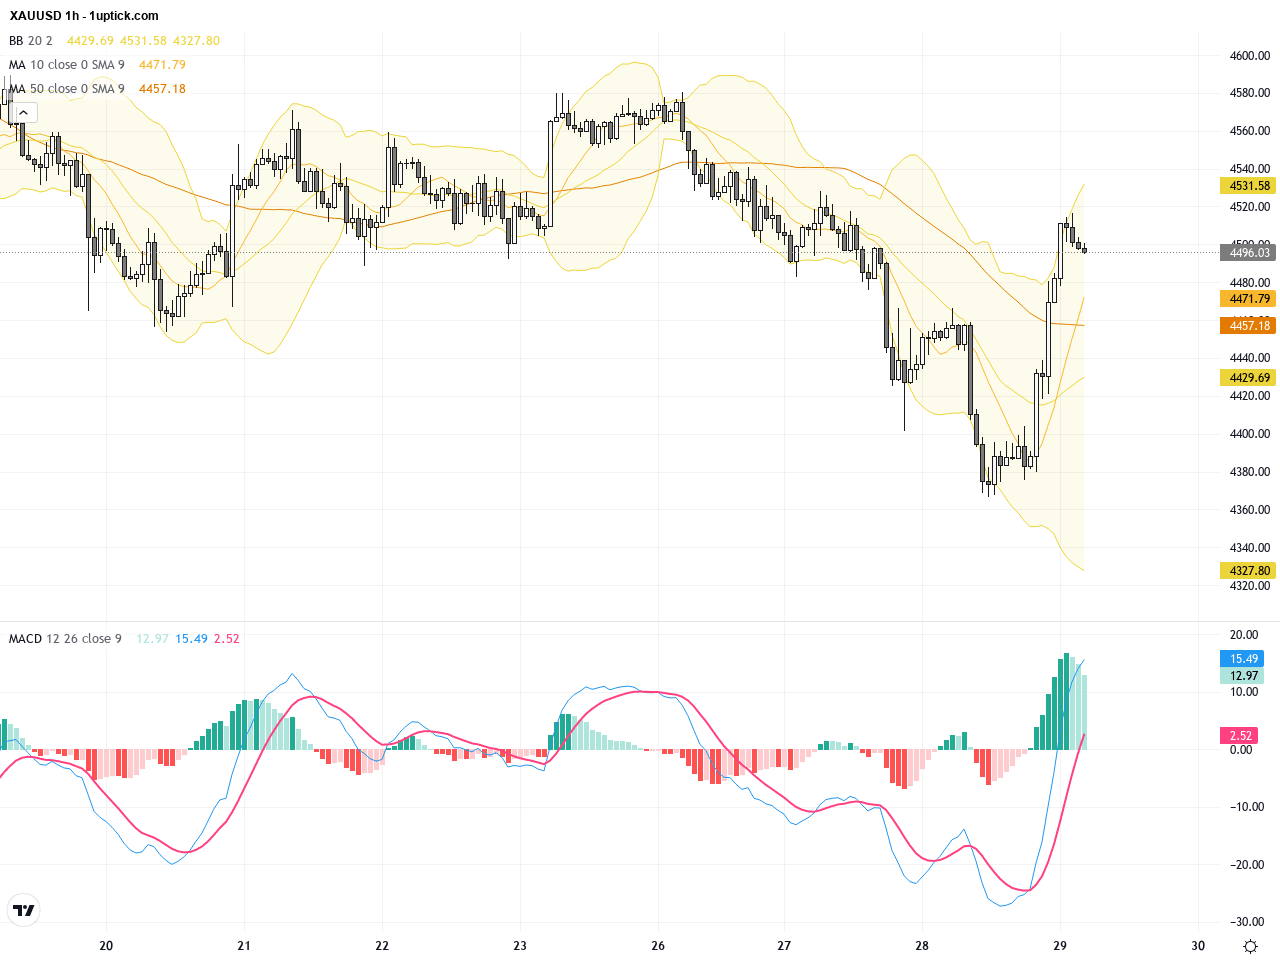
The hourly chart over the past 3-5 days shows sideways price action with mild upward bias. Short-term moving averages are intertwined signaling range-bound trading. MACD has formed a bullish crossover recently, indicating increased short-term buying momentum. Narrowing Bollinger Bands point to reduced volatility, setting the stage for a possible breakout. A recent bullish engulfing candlestick pattern further supports the short-term upside potential.
Technical Trend: Current trend is cautiously bullish consolidation with developing signs of a rebound (Cautiously Bullish Consolidation).
Technically, the 200-day moving average serves as a vital support, from which a bullish reversal has recently emerged. The MACD’s bullish crossover coupled with narrowing Bollinger Bands indicates price is poised for a directional move after consolidation. The appearance of a bullish engulfing candlestick reinforces short-term buying interest, but continued vigilance on US dollar and macroeconomic factors remains key.Today’s economic calendar reveals no major events directly impacting XAUUSD, but key US data releases at 14:30 GMT+1 including the Q1 GDP revised figures and Personal Consumption Expenditures (PCE) could influence gold price action. Weaker or lower-than-expected GDP data may support gold via dollar weakness, while stronger data could pressure gold prices. Traders should monitor these releases closely for short-term directional cues.
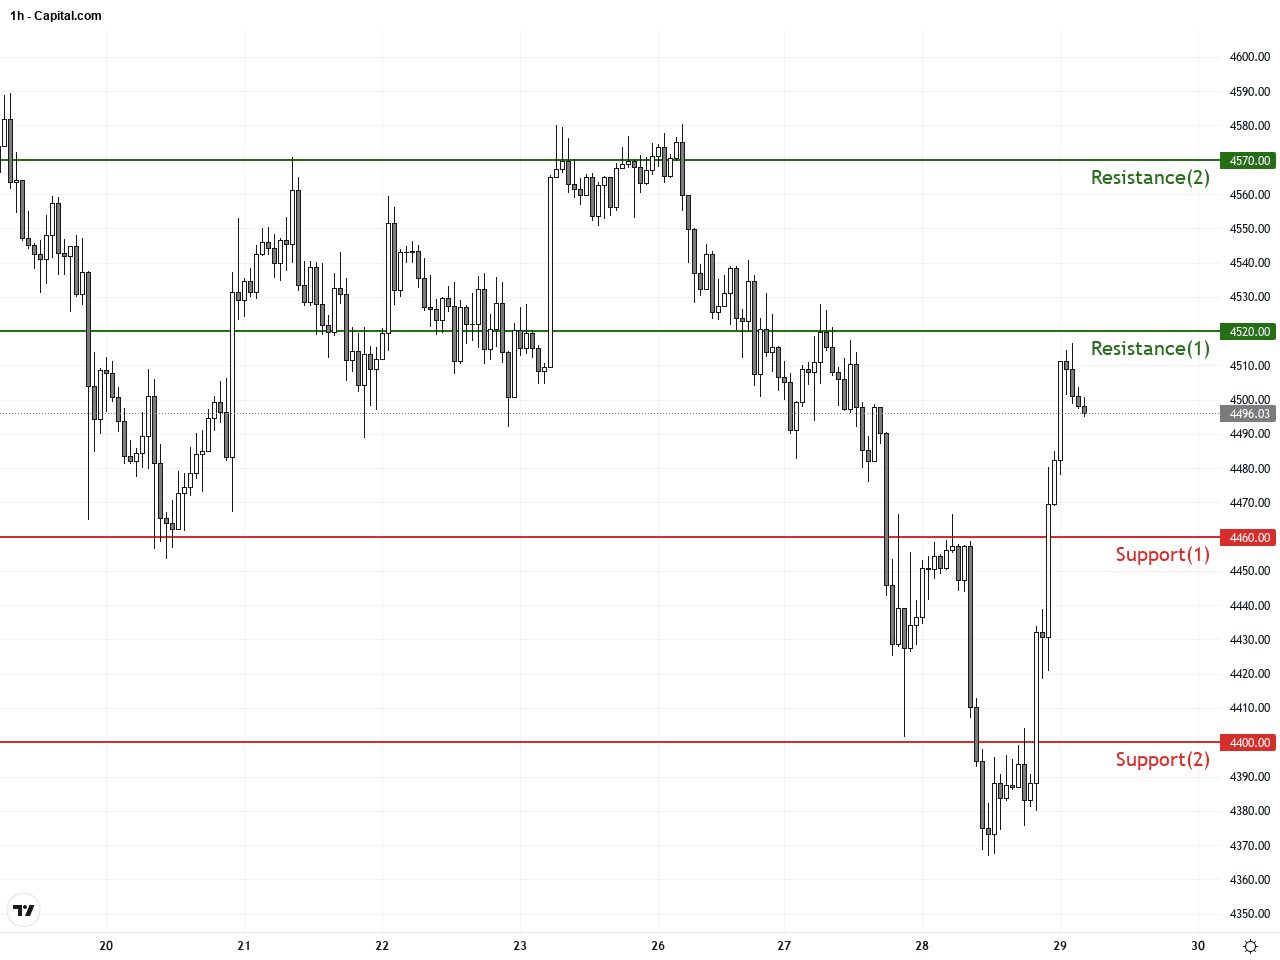
Resistance & Support
The above financial market data, quotes, charts, statistics, exchange rates, news, research, analysis, buy or sell ratings, financial education, and other information are for reference only. Before making any trades based on this information, you should consult independent professional advice to verify pricing data or obtain more detailed market information. 1uptick.com should not be regarded as soliciting any subscriber or visitor to execute any trade. You are solely responsible for all of your own trading decisions.