


 |
| Gold V.1.3.1 signal Telegram Channel (English) |

Gold Price Outlook November 2025: Key Resistance at $4,046, 50-Day MA Support, and Fed Impact on XAU/USD Trends
2025-11-08 @ 02:01
Gold continued its strong performance through early November 2025, holding firmly above its 50-day moving average and keeping traders’ attention on potential breakouts toward new highs. Recent price action highlights a critical juncture for gold (XAU/USD), as technical levels and macroeconomic signals converge to shape market sentiment for the rest of the year.
Technical Analysis: Golden Support and Key Resistance
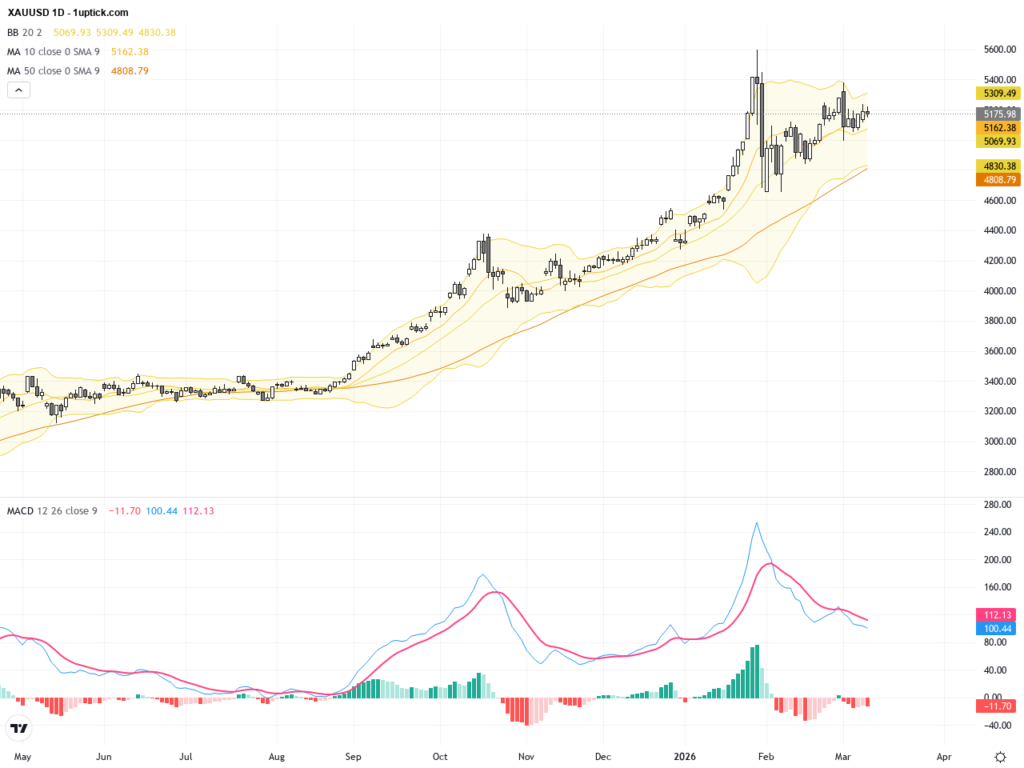
Gold’s price action in the first week of November reflected a market eager yet cautious. The metal has managed to remain above the 50-day moving average (a popular trend gauge for traders), which has acted as a dynamic support level in recent weeks. This technical resilience suggests that bullish momentum remains intact, at least for now.
The 50-day MA, currently tracked closely by market participants, is considered a dividing line between short-term bullish and bearish trends. A sustained move above this level provides a foundation for further upsides. Traders are watching the $4,046.60 mark—recent swing highs—as a pivotal resistance. A convincing breakout over this price would send a strong bullish signal and could trigger accelerated buying, potentially opening the way toward even higher targets.
However, failure to clear $4,046.60 decisively could result in renewed selling pressure. Support is found near the 50-day MA and then at deeper levels such as $4,000 and $3,960, where previous consolidation phases occurred.
Macro Drivers: The Fed, USD Index, and Rate Policy
Macroeconomic factors have played a significant role in gold’s recent moves. The Federal Reserve has continued to cut interest rates this year, a development that would typically be expected to weaken the U.S. dollar and support higher gold prices. However, the dynamics have been more complicated.
Surprisingly, despite these rate cuts, the U.S. Dollar Index (DXY) has staged a rally. This counterintuitive move is partly attributed to shifting market expectations, as the Fed’s decisions were widely anticipated and already “priced in” ahead of time. Some investors interpret ongoing rate cuts as a signal of underlying economic challenges, while others see a temporary dollar strength based on uncertainty elsewhere in global markets.
The recent rebound in the dollar—trading near key levels around 99-100—has been an important headwind for precious metals. If the DXY sustains a breakout above the psychologically significant 100 level, gold may face increased selling as investors turn their attention back to the greenback. This shift could fuel a correction in gold prices, especially if short-term bullishness in precious metals fades in the face of resurgent dollar strength.
Sentiment and Market Positioning
Gold’s rally has been underpinned in part by extreme bullish sentiment. As hedging demand remains robust and geopolitical risks persist, the market remains well-bid. However, sentiment, like price, is cyclical. When exuberance becomes widespread, gold is at risk of profit-taking—especially if macro headwinds like a stronger dollar or unexpectedly hawkish Fed statements emerge.
On the other hand, technical consolidation above major support levels could embolden buyers to re-enter on dips, providing a floor underneath prices.
Outlook: What to Watch in the Coming Weeks
The primary focus for traders in the weeks ahead is whether gold can decisively conquer the $4,046.60 resistance. A daily or weekly close above this level, especially with strong volume, could trigger a wave of momentum buying and bring new highs into view. Upside targets beyond that level will depend on the intensity of follow-through buying and the persistence of supportive macro conditions.
Conversely, repeated failures at resistance, especially if accompanied by a resurgent U.S. dollar or shifting Fed guidance, could tilt the scales back in favor of sellers. Should gold drop below its 50-day MA, a deeper pullback toward $4,000 or $3,960 would be on watch.
Big Picture: The Case for Gold in 2025
Zooming out, gold’s long-term trend remains positive. Persistent demand for hard assets amid economic uncertainty, ongoing central bank buying, and portfolio diversification needs have all contributed to elevated prices. Even with short-term volatility tied to currency moves and interest rate policy, gold continues to play a crucial role in diversified portfolios.
For those trading or investing in gold, the key is to monitor both technical signals—such as the 50-day MA and resistance near $4,046.60—and macroeconomic developments, particularly U.S. monetary policy and the dollar’s trajectory. The interplay between these factors will likely set the tone for gold’s fortunes heading into the final months of 2025.
Stay tuned for more updates as gold approaches this technical crossroads. Whether the next move is a breakout to new highs or a retreat to recalibrate, opportunity abounds for those prepared to respond to changing conditions in this dynamic market.