Month: November 2025

Gold Price Outlook: Consolidation After Record Rally, What’s Next for XAU/USD in November 2025?

Gold price is currently consolidating after a record rally, with XAU/USD testing support near the 3865 level while maintaining an overall uptrend. Despite a short-term bearish correction, bullish momentum is expected to resume, potentially driving gold prices above 4795 later in November 2025. Key technical indicators, including moving averages and RSI, support a continuation of the upward trend unless prices fall below 3535, which would signal a reversal. Market dynamics suggest gold prices remain resilient amid fluctuations in the USD Index, with the medium-term rally showing signs of exhaustion but still offering attractive trading opportunities. Investors should watch for breakouts above resistance at 4075 to confirm further gains, while caution is advised during corrections. Overall, gold is poised for continued volatility and potential growth through the month.

Gold Price Surges to $4,080: What the Fed Rate Cut Means for Investors

Gold price surges to $4,080 as the Federal Reserve cuts interest rates, signaling strong opportunities for investors. Lower rates reduce the opportunity cost of holding non-yielding assets like gold, making it more attractive amid economic uncertainty. With inflation concerns and a weakening labor market, gold continues to shine as a safe-haven investment. Analysts predict further gains, highlighting gold’s historical outperformance during rate-cut cycles. Discover how Fed rate cuts impact gold prices and what it means for your portfolio.

EURUSD: Bulls and Bears Battle at Resistance—Watch These Levels for a Major Breakout

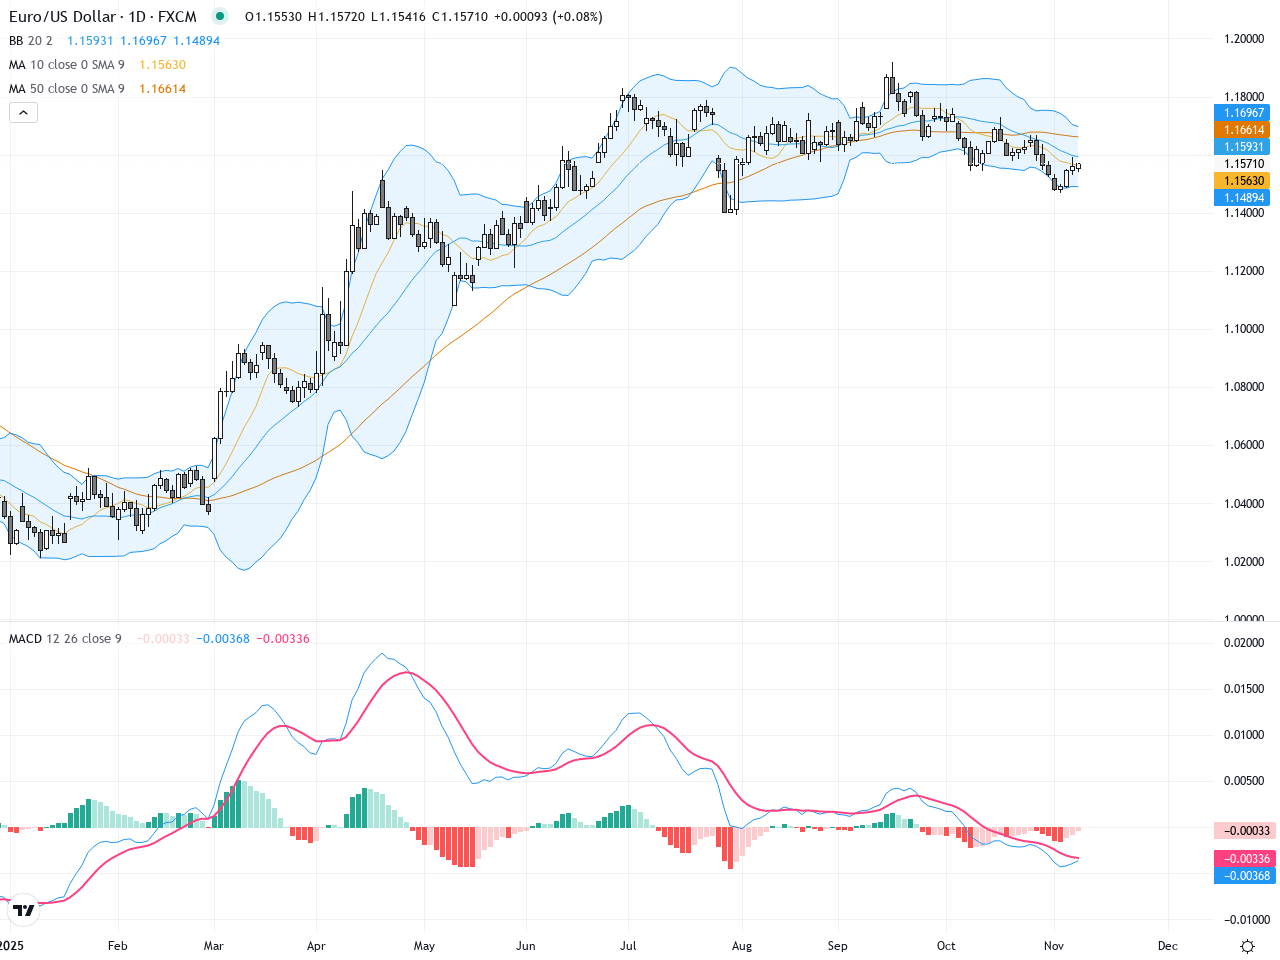
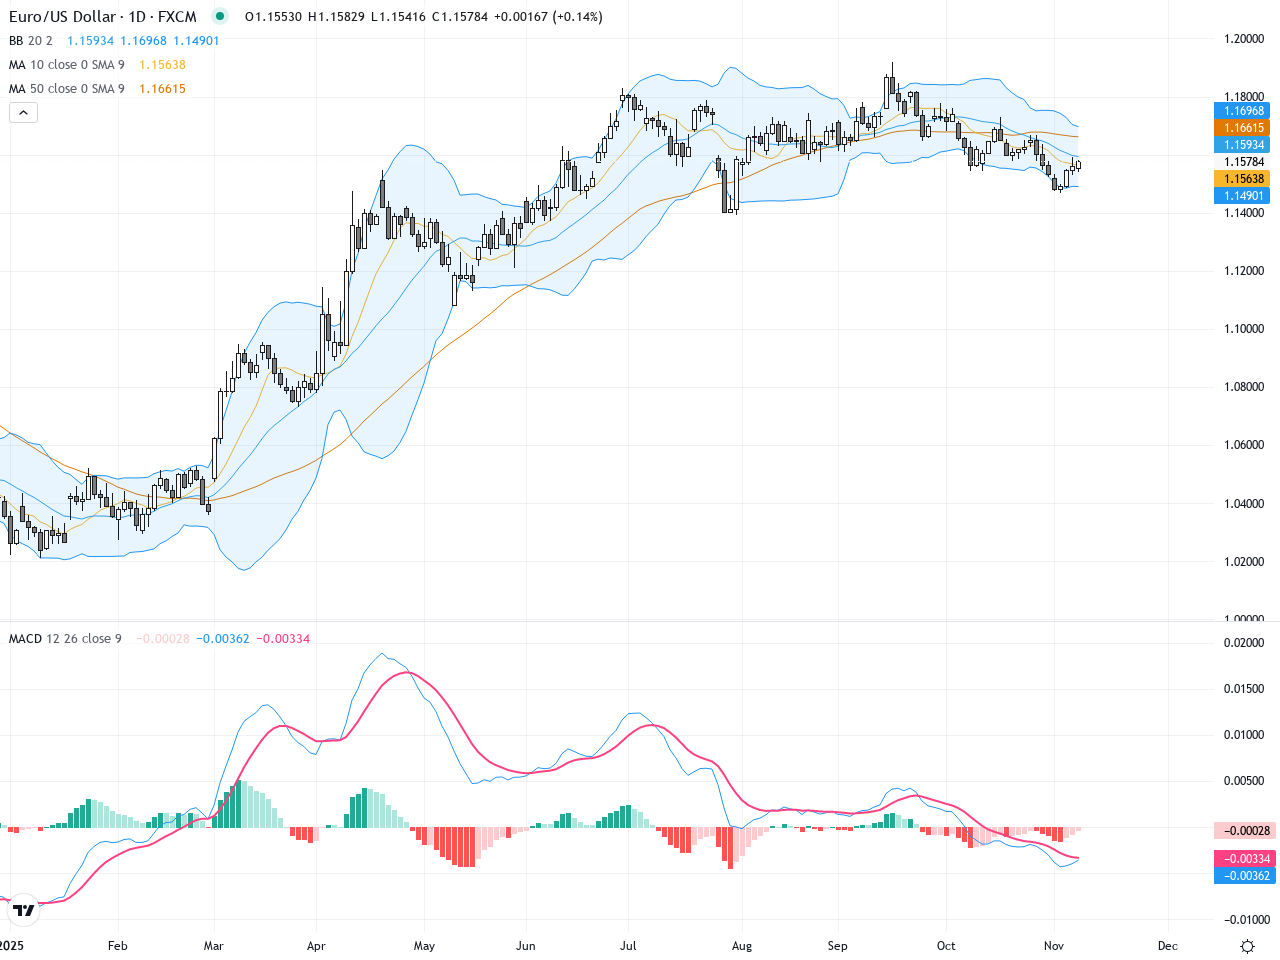
Over the past three trading days, EURUSD has been caught in a tight range, closing at 1.15789 after failing to sustain a push above 1.15830. With no significant Eurozone or US data releases, technicals have taken center stage. Traders are laser-focused on key support and resistance levels; a decisive break could trigger a wave of volatility. For investors, this is a textbook scenario where tactical trades around well-defined levels offer the best chance for profits. The current range is a pressure cooker—be ready when the lid blows off.

GBPUSD: Triangle Squeeze Signals a Breakout—Sterling Approaches Make-or-Break Zone

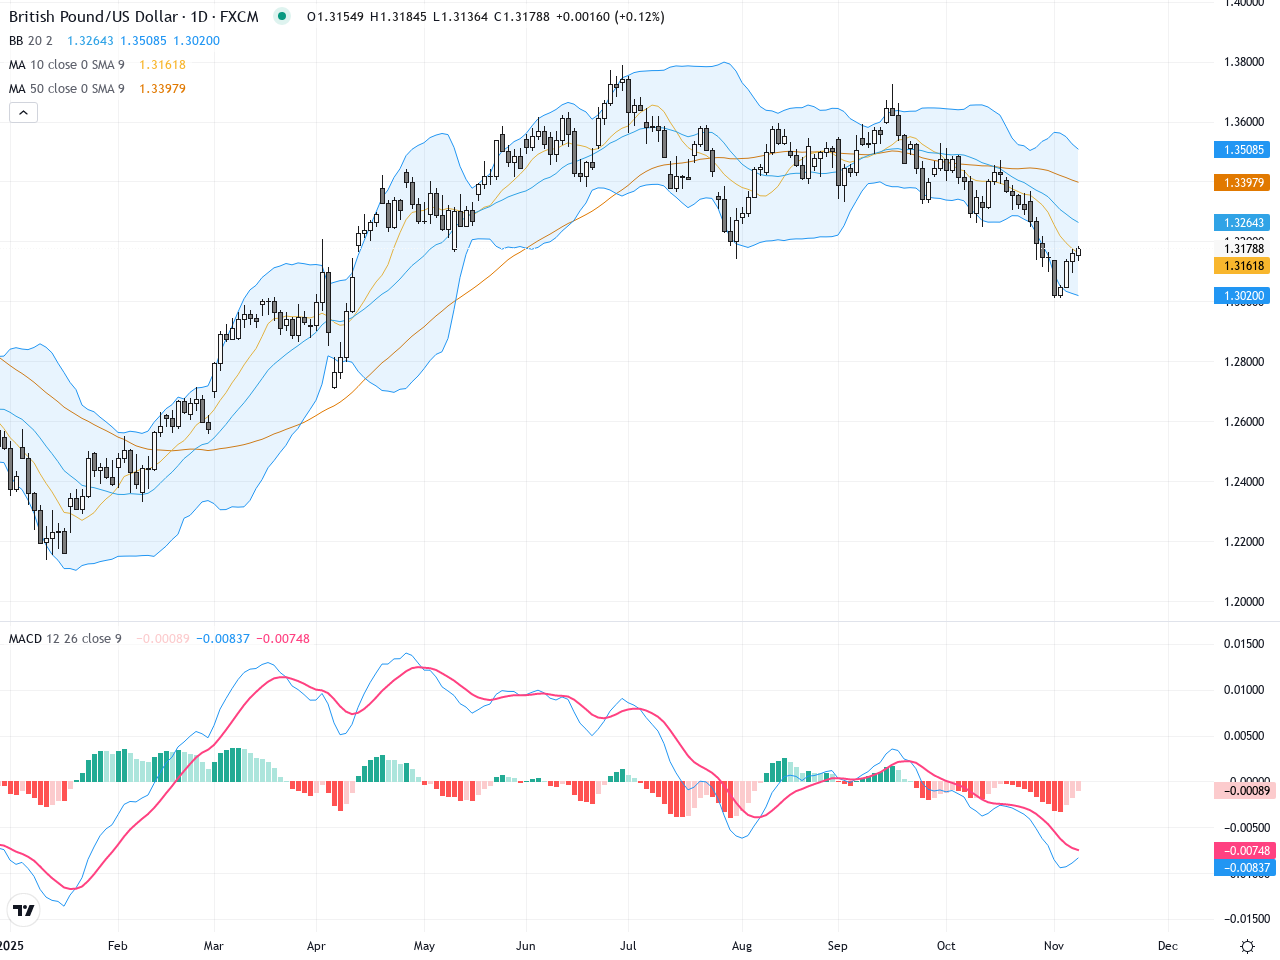
Over the past three trading days, GBPUSD has whipped between 1.31 and 1.32, closing at 1.31789 on November 9, right at the upper edge of its recent range. With no major news headlines in the last week, all eyes are on upcoming UK and US CPI data, leaving investors in cautious mode. This week’s price indecision forms a classic technical squeeze—GBPUSD is coiling for a breakout. For the average market participant, this means sitting tight: momentum is building, and once the triangle pattern breaks, volatility will return in force. The current GBPUSD Price Analysis is a story of patience—watching for a confirmed push above resistance or a drop below support to unleash the next big move. Short-term traders benefit most by waiting for this crucial trigger and keeping stops tight in this high-volatility setup.

USDJPY: Ascending Flag Breakout Signals Trader Showdown Near 154.40

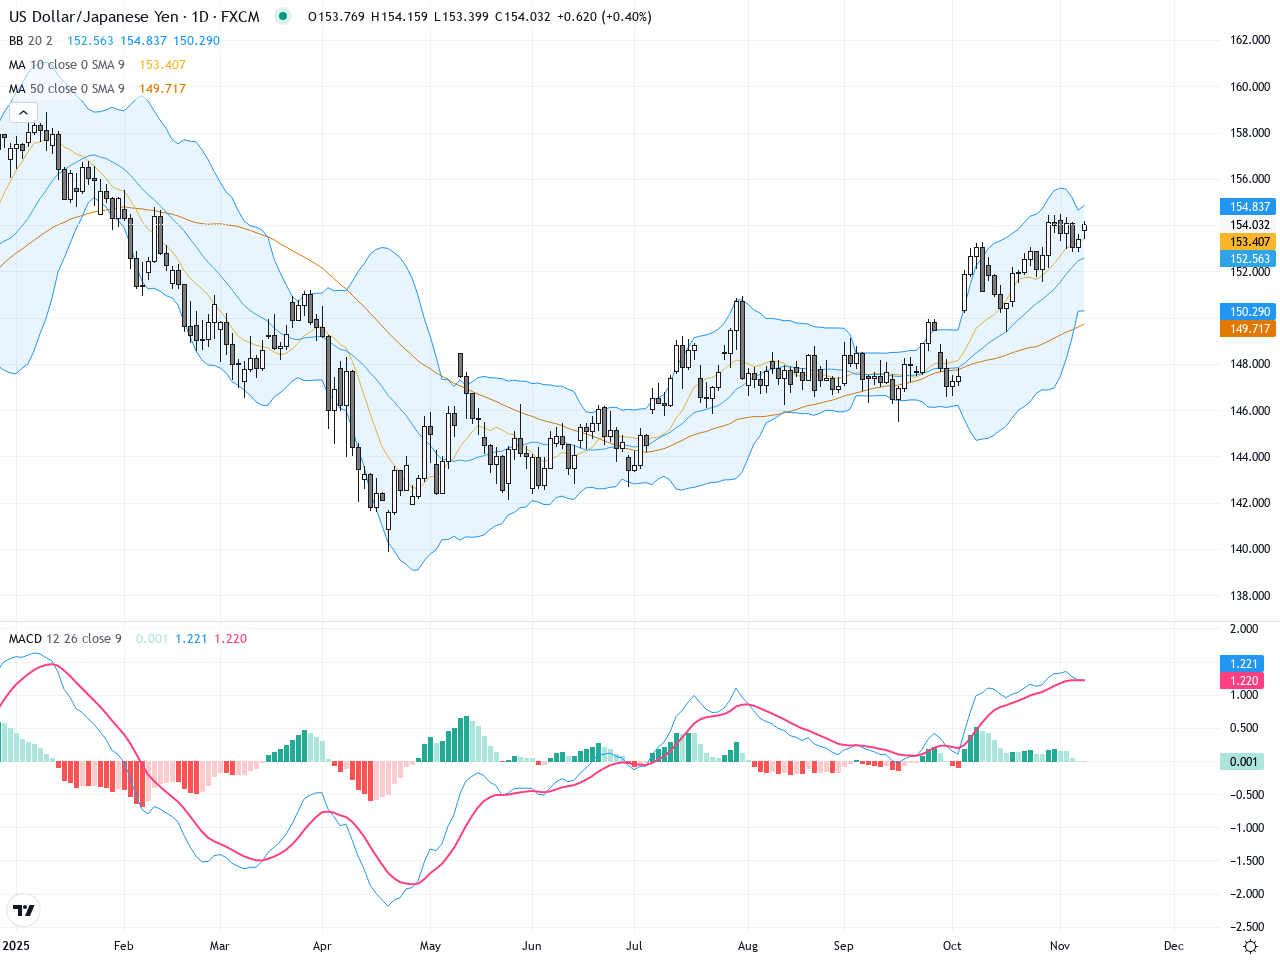
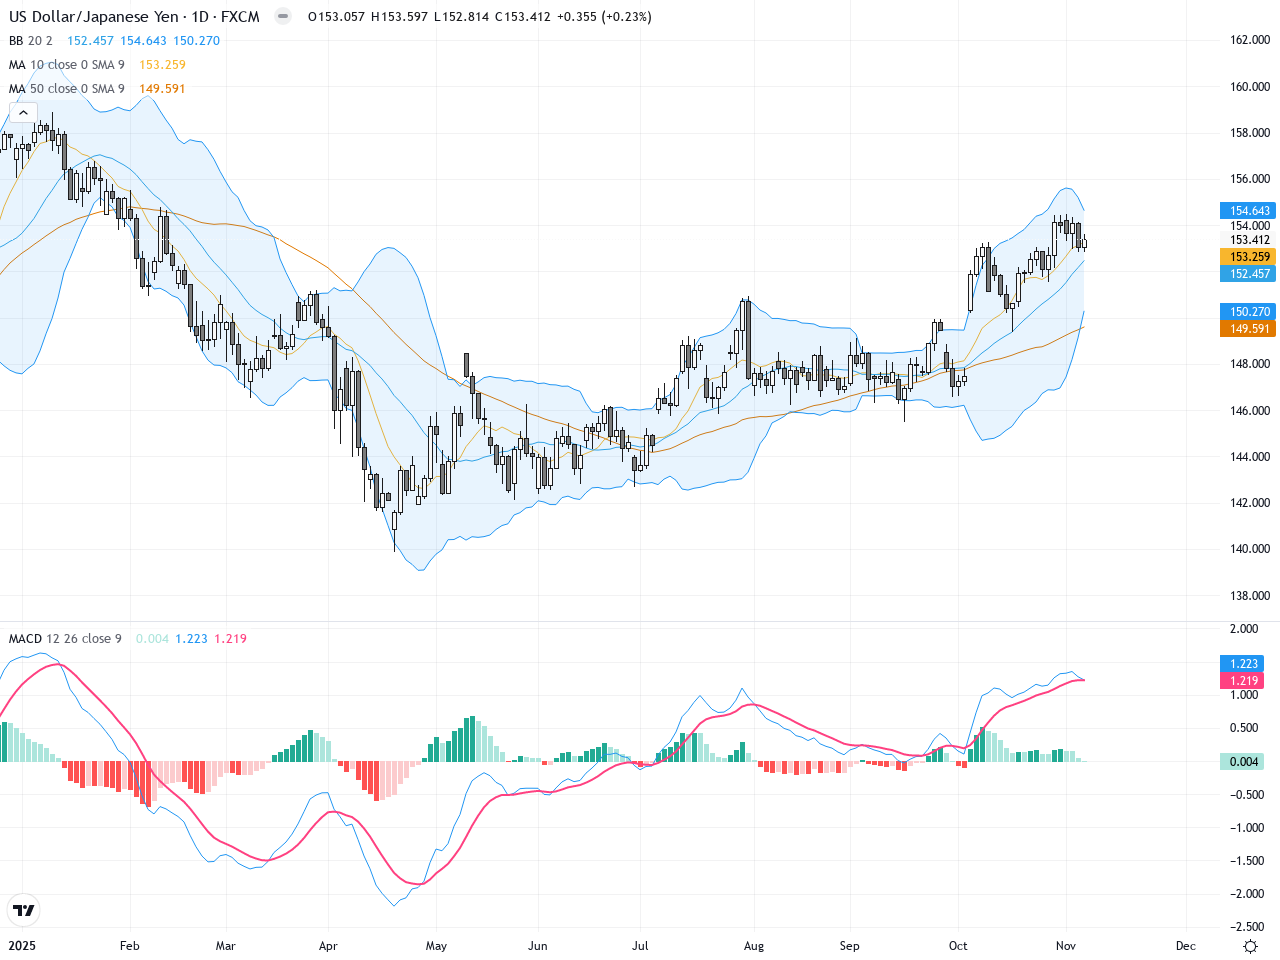
USDJPY has been surging in the past three sessions, closing at 153.989 yesterday (+0.4%), reflecting ongoing volatility and a tug-of-war at key resistance. No major headlines hit the tape, but traders remain hyper-sensitive to BOJ policy hints and the aftermath of the latest US jobs data. The lack of clear news leaves price action and technicals firmly in the spotlight. For the average investor, USDJPY is now at an inflection point: will the yen rebound on policy shifts or does the dollar keep the upper hand? With prices consolidating near highs and key technical levels under pressure, risk control is paramount—the next breakout could define the trend into year-end.

GBPUSD: Major Resistance Test Looms as Tight Range Signals a Breakout Setup

GBPUSD has spent the past three trading days largely consolidating between 1.313 and 1.316, closing yesterday at 1.31468. Price action has been muted, but trading volume is on the rise, indicating cautious sentiment and a buildup in positioning. With no major market news impacting the pair, technical factors dominate—especially as bulls and bears battle near the weekly high at 1.31664 and support at 1.31335. For everyday investors, the takeaway is clear: GBPUSD’s calm may quickly give way to a sharp move once breakout momentum builds, so vigilance is key as the market positions for a technical catalyst.

EURUSD: Fresh Weekly Trading Outlook, Technical Signals & Key Fundamental Shifts

EURUSD demonstrated notable volatility over the past three trading days, with a latest close at 1.15712—slightly higher from yesterday. Although no major news headlines hit the tape this week, the market’s price movement reflected uncertainty ahead of eurozone and US data releases. This drove EURUSD to trade between 1.149 and 1.159, making investors feel the quintessential end-of-reporting season tension. Active traders are tightly focused on crucial support and resistance, bracing for quick breakouts or reversals. With markets awaiting new catalysts, this choppy action is likely to persist. Technically, EURUSD exhibits a fresh divergence worth attention.

USDJPY Price Analysis: Key Technical Trading Outlook & Levels as Bulls Test Highs

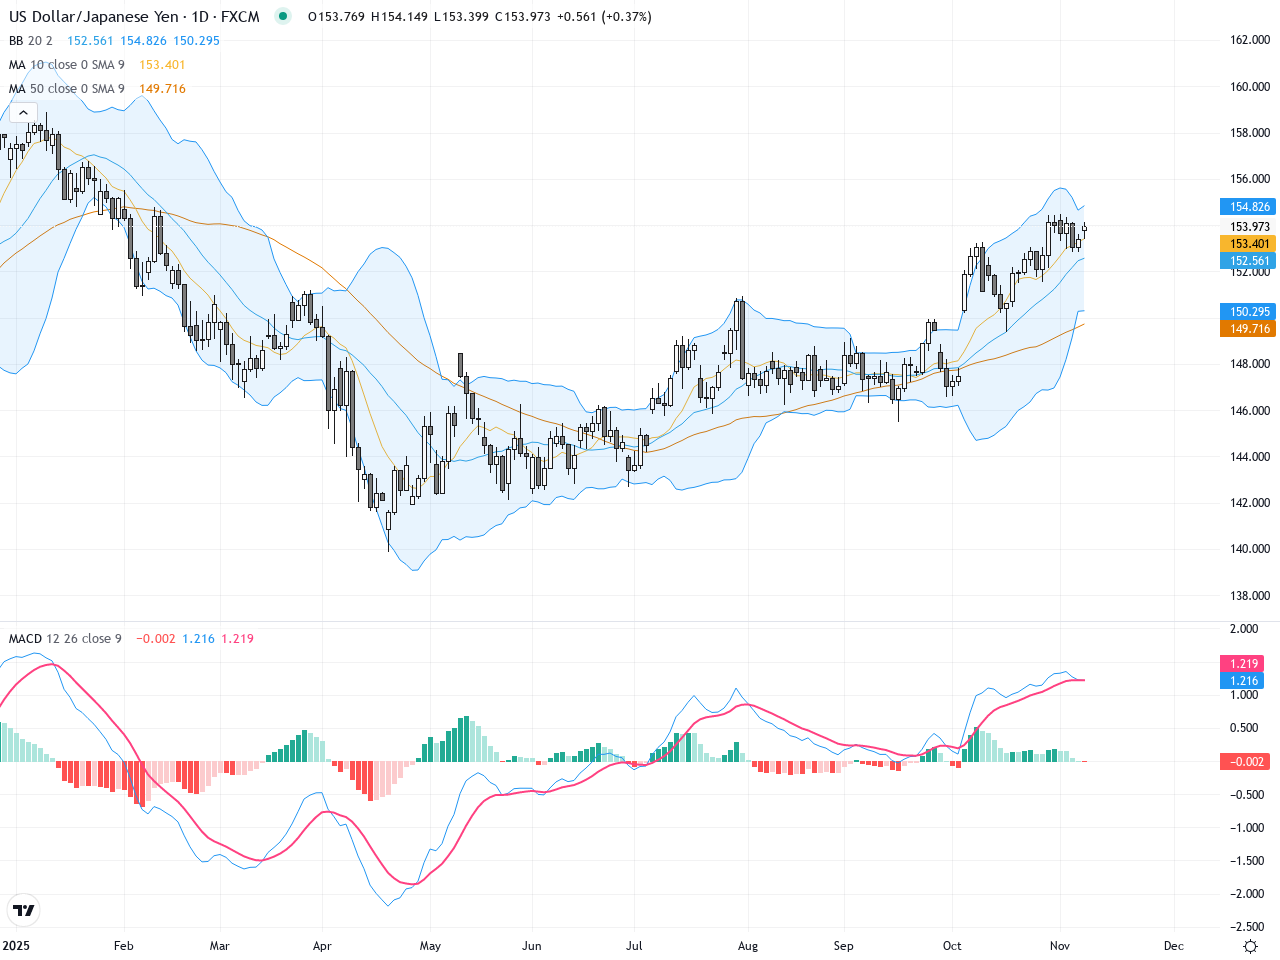
Over the past three trading days, USDJPY has shown a bullish tilt, consolidating near 154 with a last close at 153.97. Despite the lack of major news, technicals dominate sentiment: strong US-JP yield differentials keep the pair elevated, while traders eye possible corrections and renewed upside tests. Chart patterns indicate that as long as the 152.65 support level holds, bulls are likely to remain in control, with scope for a fresh move to recent highs. This choppy consolidation reflects investor caution regarding possible BOJ intervention and shifting US rates. A solid bounce from key supports may trigger a surge in trading volumes and new trading opportunities. The current USDJPY price analysis puts the spotlight on precise support resistance levels and momentum shifts that active traders need to watch closely.

USDJPY Trading Outlook: Bold Technical Patterns and Key Market News Unpacked

Over the past three trading days, USDJPY has held resilient near the 153.39 close. Volatility surged around US economic data uncertainty—with the ongoing government shutdown risking delays in key CPI and PPI releases—while Japan’s economy shows persistent wage weakness and softer household spending. After Thursday’s brief JPY rally on risk aversion, buyers returned as US yields stabilized, driving USDJPY above 153 again. For traders, the landscape is choppy and full of headlines, with immediate price decision points shaped by news sensitivity and technical formations. This outlook distills the latest market fundamentals and chart signals, arming investors with actionable analysis for USDJPY’s next move.

AUDUSD: Support, Resistance and Trading Setup

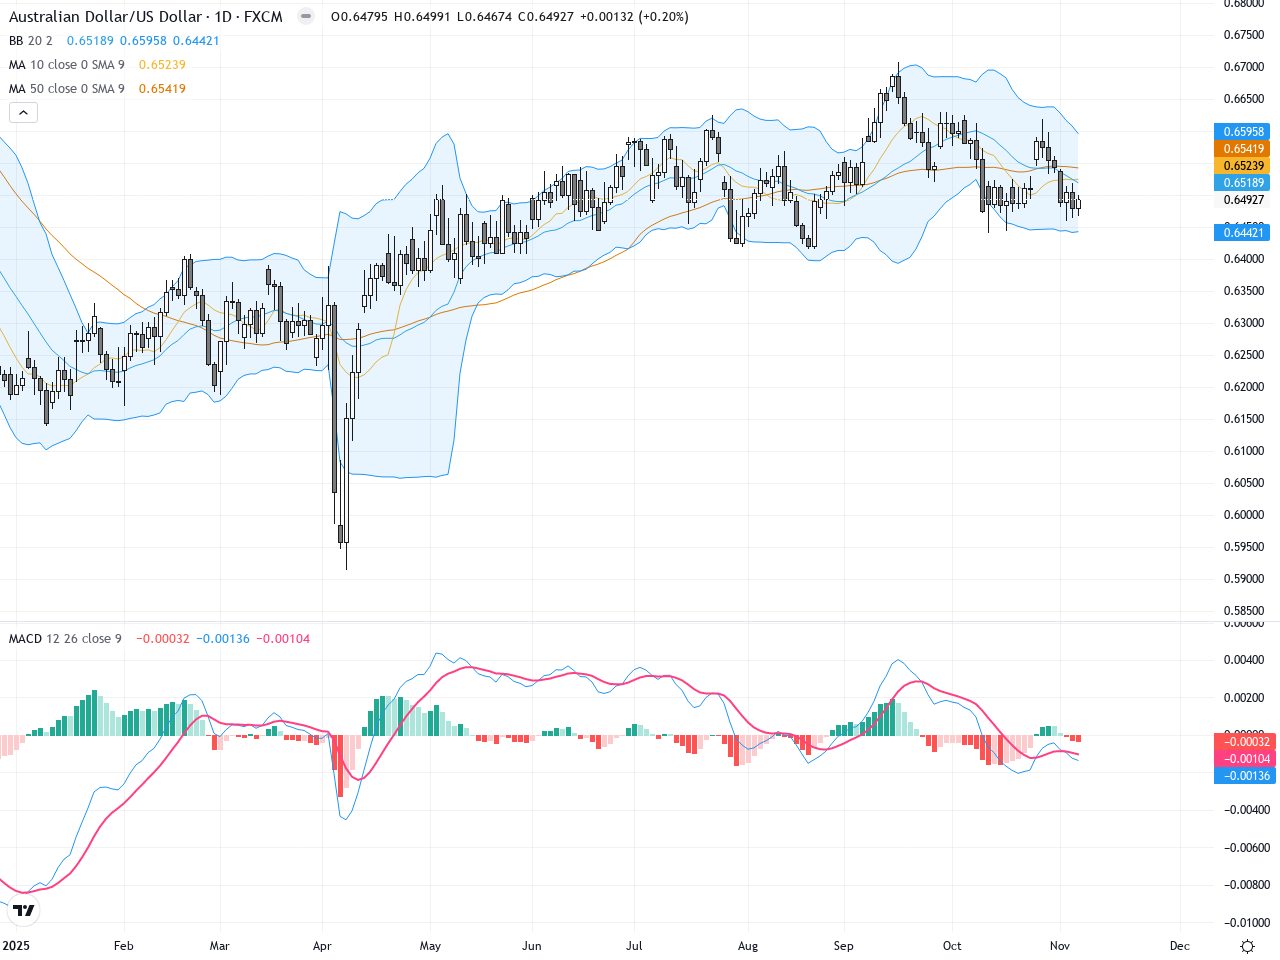
Over the past three trading days, AUDUSD has faced intense selling pressure, closing yesterday at 0.65137 despite brief intraday highs. Market volatility has been driven by global equity sell-offs, heightened US-China tech tensions, and the Australian central bank’s hawkish stance—factors weighing heavily on the Aussie. With no major bullish catalysts in recent headlines, buying momentum remains weak. The story for average investors: the Australian dollar is acting as a risk barometer and continues to struggle as sentiment sours. Price action near the 0.65 handle and persistent rejections signal technical bearishness, making downside risk the key focus of this AUDUSD Price Analysis.

1uptick Analytics @

Risk Warning​

*Investment involves risk. You may use the information, strategies and trading signals on this website for academic and reference purposes at your own discretion. 1uptick cannot and does not guarantee that any current or future buy or sell comments and messages posted on this website/app will be profitable. Past performance is not necessarily indicative of future performance. It is impossible for 1uptick to make such guarantees and users should not make such assumptions. Readers should seek independent professional advice before executing a transaction. 1uptick will not solicit any subscribers or visitors to execute any transactions, and you are responsible for all executed transactions.

© 2022-26 1uptick Analytics all rights reserved.


Risk Warning​

*Investment involves risk. You may use the information, strategies and trading signals on this website for academic and reference purposes at your own discretion. 1uptick cannot and does not guarantee that any current or future buy or sell comments and messages posted on this website/app will be profitable. Past performance is not necessarily indicative of future performance. It is impossible for 1uptick to make such guarantees and users should not make such assumptions. Readers should seek independent professional advice before executing a transaction. 1uptick will not solicit any subscribers or visitors to execute any transactions, and you are responsible for all executed transactions.

© 1uptick Analytics all rights reserved.

Home
.AI
Analysis
Calendar
Tools