








 |
| Gold V.1.3.1 signal Telegram Channel (English) |
WTI Crude Oil: Critical Dip Below $90 Highlights Key Support and Resistance Levels, May 26, 2026
2026-05-26 @ 06:03
Over the past 24 to 48 hours, WTI crude oil prices experienced notable volatility, with the closing price dropping below $90 per barrel for the first time since May 7, down from yesterday’s close of $90.3. Market sentiment shifted as recent news highlighted progress in US-Iran peace talks, which is driving optimism for reopening the Strait of Hormuz and easing geopolitical tensions that had previously inflated oil price risk premiums.
Additionally, weak economic data from China and steady production levels maintained by OPEC+ intensified supply-demand balance adjustments, pressuring prices further. For average investors, this price drop reflects a dual impact of diminished geopolitical risk and ongoing global economic uncertainty. In other words, while the decline may raise concerns, it also signals the market’s gradual unwinding of the previous fear-driven premium embedded in oil prices.

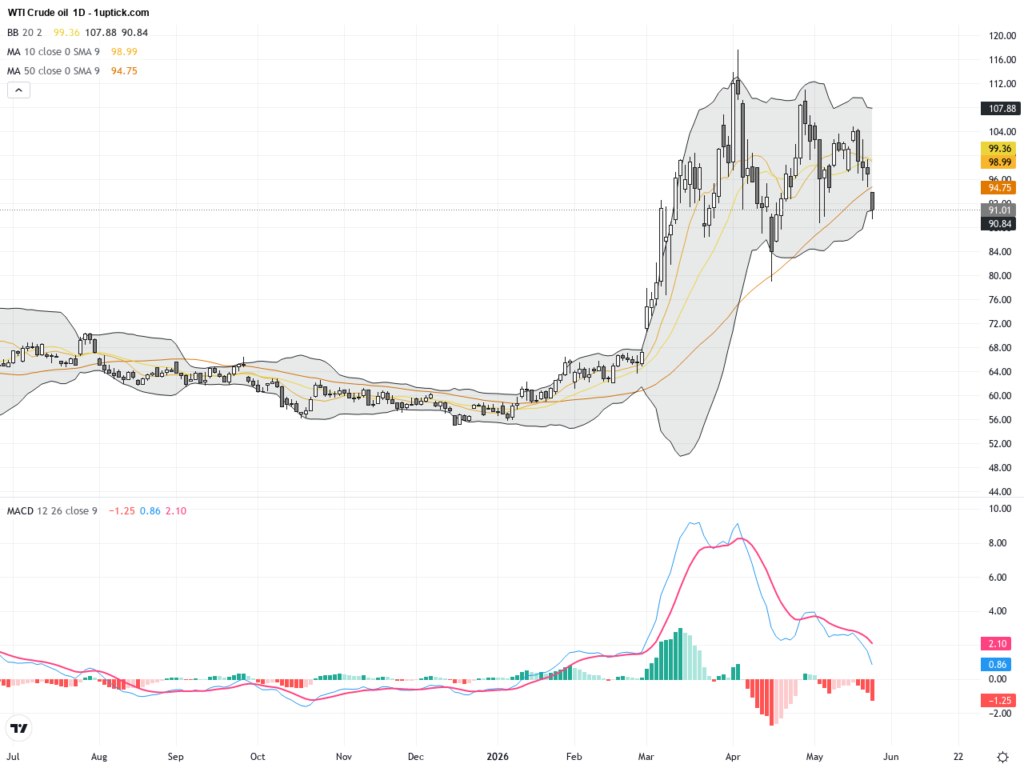
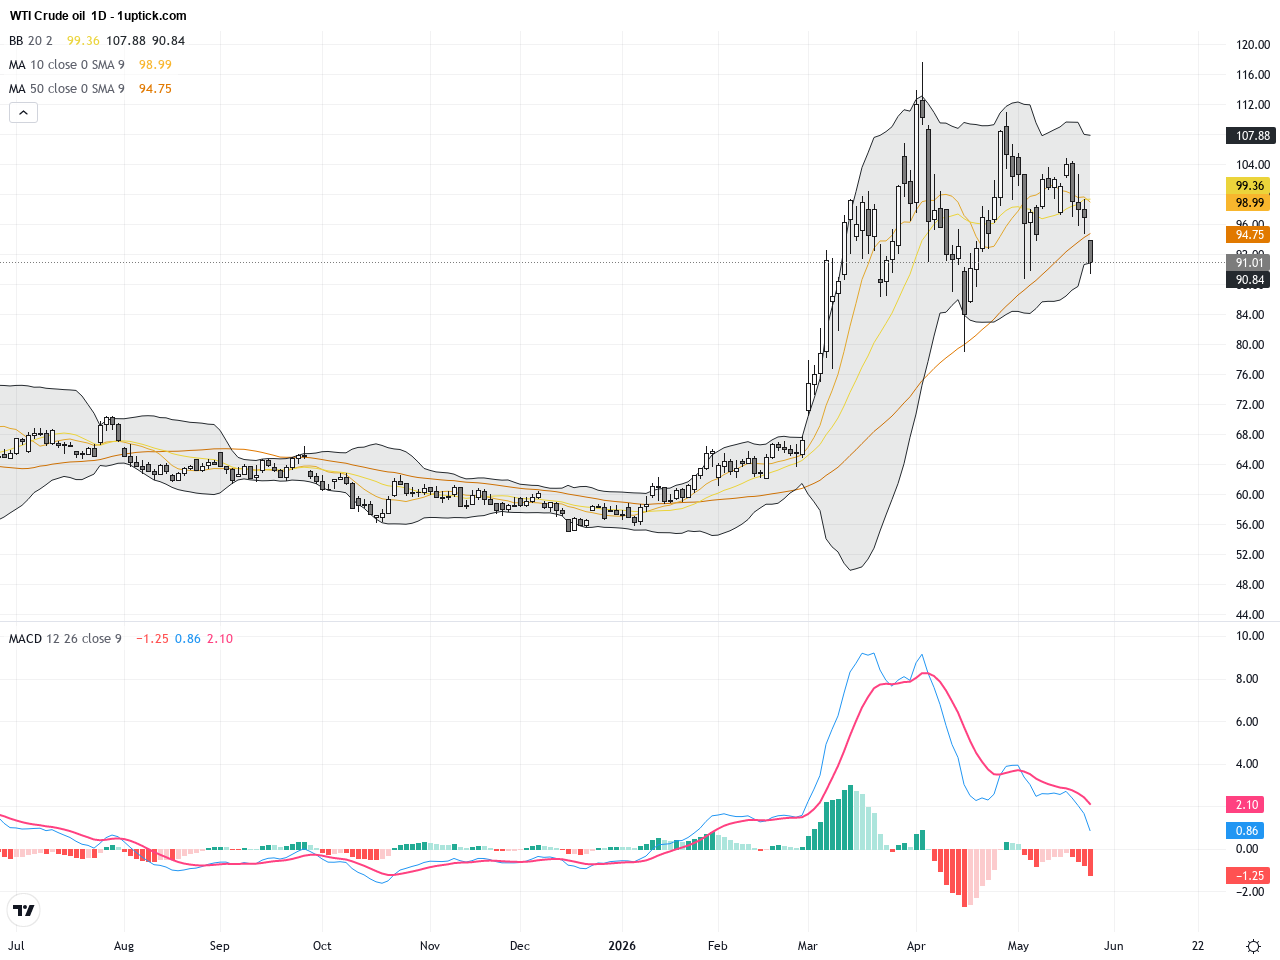
The daily chart reveals a clear downtrend since mid-May, with WTI falling from highs near $104 to retesting the $90 psychological level. The 20-day and 50-day moving averages indicate bearish momentum, supported by a MACD in negative territory. Bollinger Bands show a squeeze with price breaking below the lower band, suggesting potential for continued correction or consolidation. Unless there is an effective reversal above the descending trend line, downside pressure remains dominant.

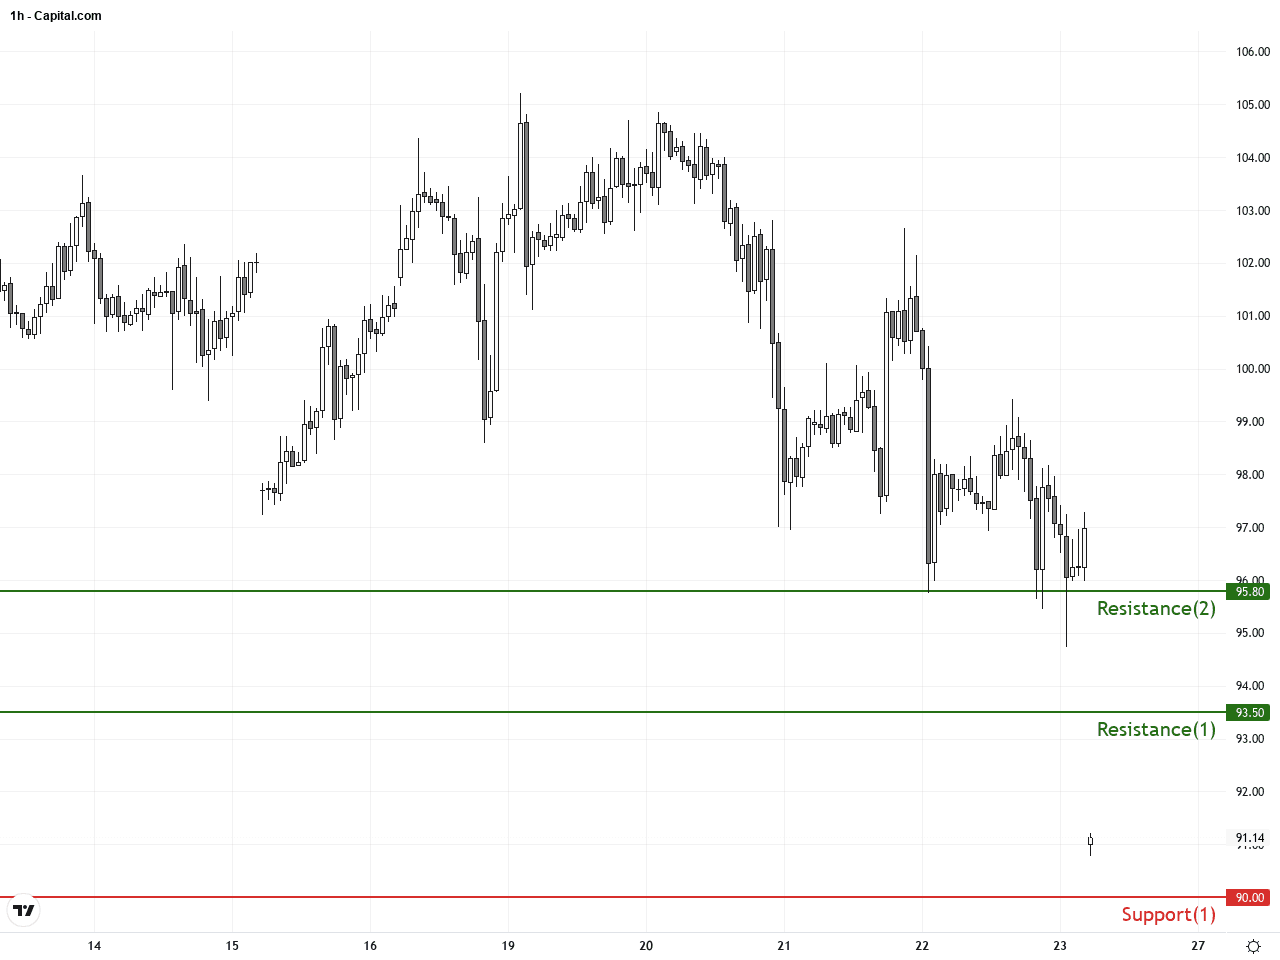
On the hourly chart, WTI has been consolidating between $90 and $94 over the past five trading days, forming a bearish descending triangle pattern. The 5 and 20 EMA exhibit a short-term bearish crossover, Bollinger Bands narrow, and MACD remains below zero. The recent hammer candlestick signals possible short-term support around $90, potentially triggering a technical bounce if the level holds in the next 24 hours.
Technical Trend: WTI Crude Oil is currently exhibiting a pronounced bearish trend with cautious short-term consolidation possible. The overall trend remains decisively bearish.
Technically, WTI is in a firm downtrend with expanding MACD negativity and a breach of the lower Bollinger Band, indicating weakening momentum. The hourly hammer and increased volume suggest early signs of stabilization, yet confirmation via MACD bullish crossover or RSI divergence is needed for a reliable short-term reversal signal. Traders should remain cautious and watch for momentum shifts around the $90 support zone.There are no significant or directly relevant economic events scheduled today that would impact WTI Crude Oil. Market participants will continue to monitor broader macroeconomic trends and geopolitical developments for directional cues.
Resistance & Support
The above financial market data, quotes, charts, statistics, exchange rates, news, research, analysis, buy or sell ratings, financial education, and other information are for reference only. Before making any trades based on this information, you should consult independent professional advice to verify pricing data or obtain more detailed market information. 1uptick.com should not be regarded as soliciting any subscriber or visitor to execute any trade. You are solely responsible for all of your own trading decisions.