 |
| Gold V.1.3.1 signal Telegram Channel (English) |
AUDUSD: Key Support Holds Amid Price Rebound and Technical Consolidation
2025-12-19 @ 08:02
Over the past 24 to 48 hours, the AUD/USD has been searching for support, hovering around yesterday’s closing price of 0.66142. Amid a backdrop of risk-off sentiment, the Australian Dollar showed resilience but remained under pressure overall. Recent market news highlights a decline in global equities that triggered outflows from the Aussie into safe-haven assets, reflecting a reduction in investors’ risk appetite.
Specifically, the US Consumer Price Index (CPI) data has been a key market focus, strengthening the US dollar and weighing on the AUD. Nevertheless, the AUD has found short-term support around the 0.6600 level, showing signs of stabilization and offering buying opportunities amid the volatility. Additionally, rising copper prices have provided some backing for the AUD, as Australia is a major copper producer and commodity prices are closely linked to the currency’s performance.
For the average investor, this means a cautious market stance towards the AUD, with prices facing some downward pressure but maintaining crucial support. Close attention to upcoming US CPI data and global risk sentiment shifts is essential. The recent fluctuations serve as a reminder to align positions with risk tolerance and to stay agile in response to market changes.

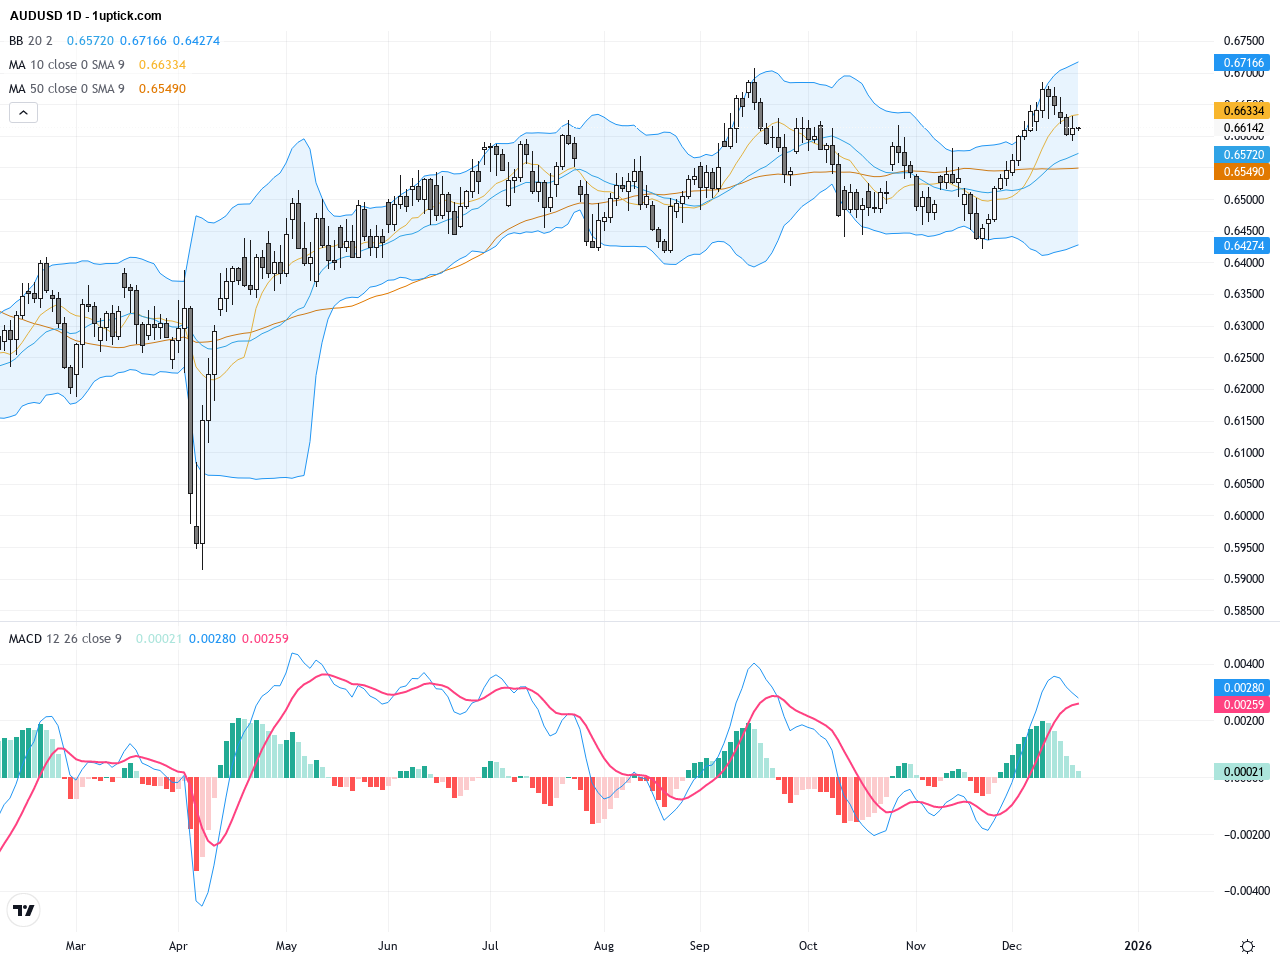
The daily chart illustrates AUDUSD trading in a clear consolidation range between roughly 0.6600 and 0.6700 over recent weeks. The 50-day moving average (around 0.65424) and 200-day moving average (near 0.64825) are trending slightly upwards, suggesting medium to long-term support. The Bollinger Bands are tightening indicating reduced volatility and the MACD hovers near the zero line, reflecting a pause in momentum and balanced forces between bulls and bears, favoring continued lateral movement in the near term.
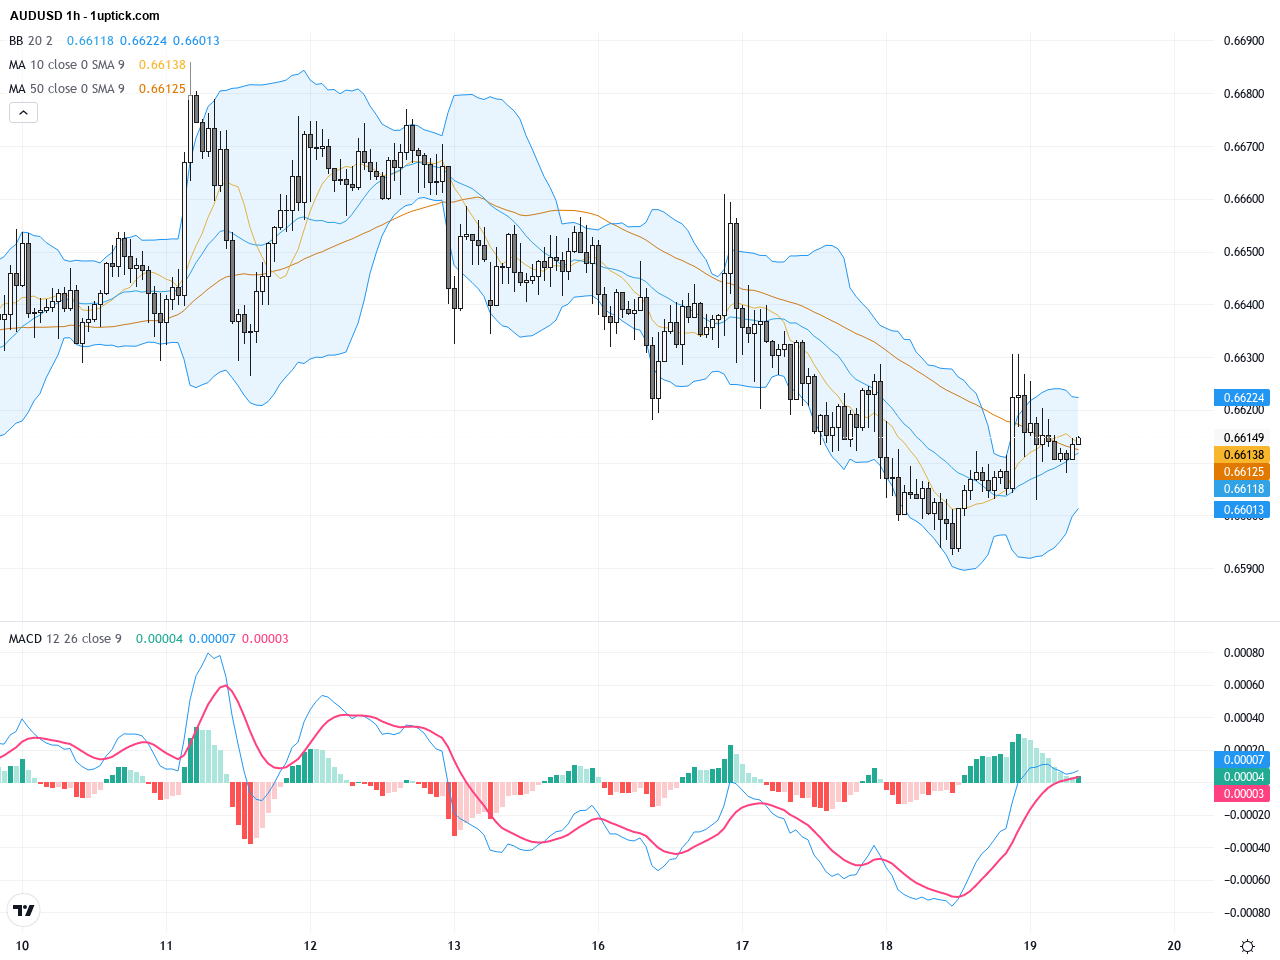
On the hourly timeframe, price action over the last 3-5 days shows a strong support response around the 0.6600 level with multiple rebounds. Short-term moving averages like the 20 EMA have begun to cross upwards, and MACD histogram bars reflect an emerging bullish momentum. Bollinger Bands are contracting as price oscillates near the middle band, signaling cautious market sentiment awaiting a decisive breakout.
Technical Trend: The current trend exhibits cautious consolidation, warranting a wait-and-see approach until clear directional cues emerge.
AUDUSD is showing firm bullish defense near 0.6600 support, with MACD maintaining a positive momentum and short-term moving averages crossing upward as a potential buy signal. However, daily Bollinger Band contraction and slowing momentum emphasize the current rangebound environment. Traders should keep a close eye on downside risk below 0.6600 and potential breakout above 0.6700 that may lead to renewed bullish momentum.Today’s economic calendar features the Reserve Bank of Australia’s Private Sector Credit report as the most relevant event for AUDUSD, forecasted at a 0.2% monthly increase, down from last month’s 0.7%. Additionally, the Bank of Japan rate decision and press conference are scheduled but have limited direct impact on AUDUSD. Overall, no major direct economic events are expected to trigger immediate AUDUSD volatility today; traders should watch the Australian credit data release for potential market reaction.
Resistance & Support

The above financial market data, quotes, charts, statistics, exchange rates, news, research, analysis, buy or sell ratings, financial education, and other information are for reference only. Before making any trades based on this information, you should consult independent professional advice to verify pricing data or obtain more detailed market information. 1uptick.com should not be regarded as soliciting any subscriber or visitor to execute any trade. You are solely responsible for all of your own trading decisions.