


 |
| Gold V.1.3.1 signal Telegram Channel (English) |
USDJPY Technical and Fundamental Analysis: Dollar Strength Pressures Yen with Key Resistance Levels to Watch, May 15, 2026
2026-05-15 @ 11:01
Over the past 24 to 48 hours, the USD/JPY pair has shown continued volatility with an upward bias, moving above yesterday’s close at 158.524. The US Dollar Index (DXY) reached 1.5-week and 2-week highs on Wednesday and Thursday respectively, rising by 0.22% and 0.29%, supported by signs of a resilient US economy and a strong Producer Price Index (PPI) report. These positive economic signals fueled expectations of ongoing or additional Federal Reserve rate hikes, propelling the USD/JPY pair higher.
Meanwhile, developments from the Bank of Japan (BoJ) minutes suggest an earlier-than-expected rate hike, enhancing the yen’s yield attractiveness for carry trades. However, markets remain cautious with fears of potential Japanese government intervention to curb excessive yen depreciation, which has capped the USD/JPY upside. The yen came under continued pressure, with the pair rising to 157.65 on Wednesday—marking its third consecutive day of gains—but intervention concerns keep traders wary.
For the average investor, this situation is like an ongoing tug-of-war—the US dollar rallies on strong economic fundamentals, while the yen faces mixed signals due to policy uncertainty and intervention risks. This dynamic heightens volatility in USD/JPY, reflecting investors’ delicate balancing act between risk and reward amid global economic uncertainty. Going forward, any news regarding Fed policy or Japanese market intervention will likely have a significant impact on the price direction of this major currency pair.

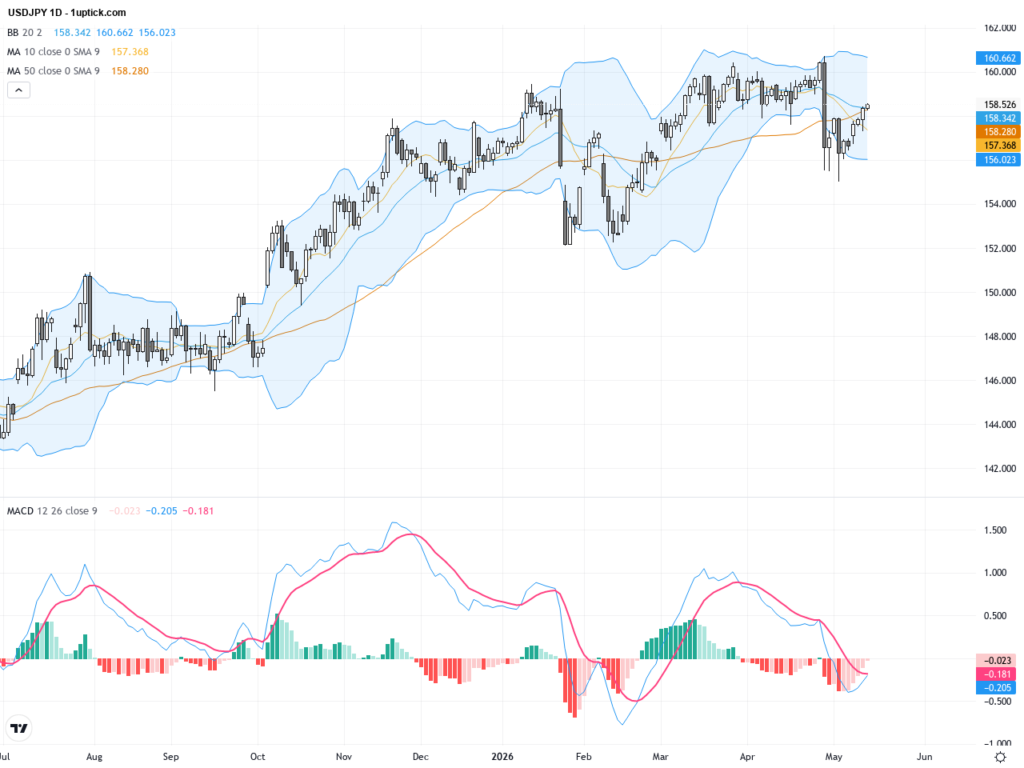
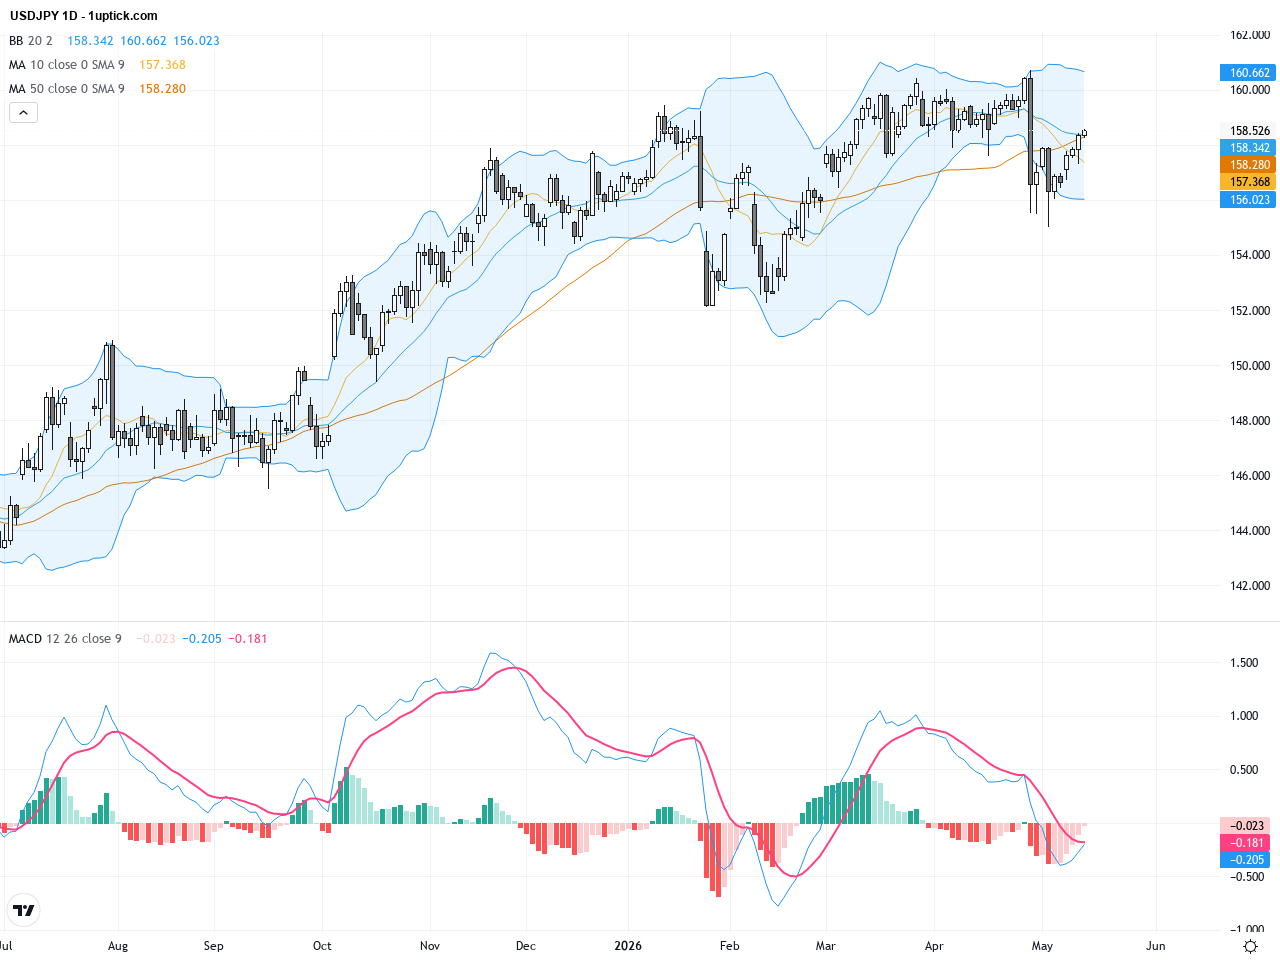
The daily chart shows a sustained uptrend in USDJPY since the start of the year, with recent price facing resistance near 158.7. The 50-day moving average is above current price levels at approximately 158.7, while the 200-day moving average remains significantly lower around 154.3, indicating a long-term bullish bias. Bollinger Bands indicate prices are near the upper band, implying possible short-term pullback risk. The MACD remains positive though histogram bars suggest momentum is fading, signaling caution for the bulls.
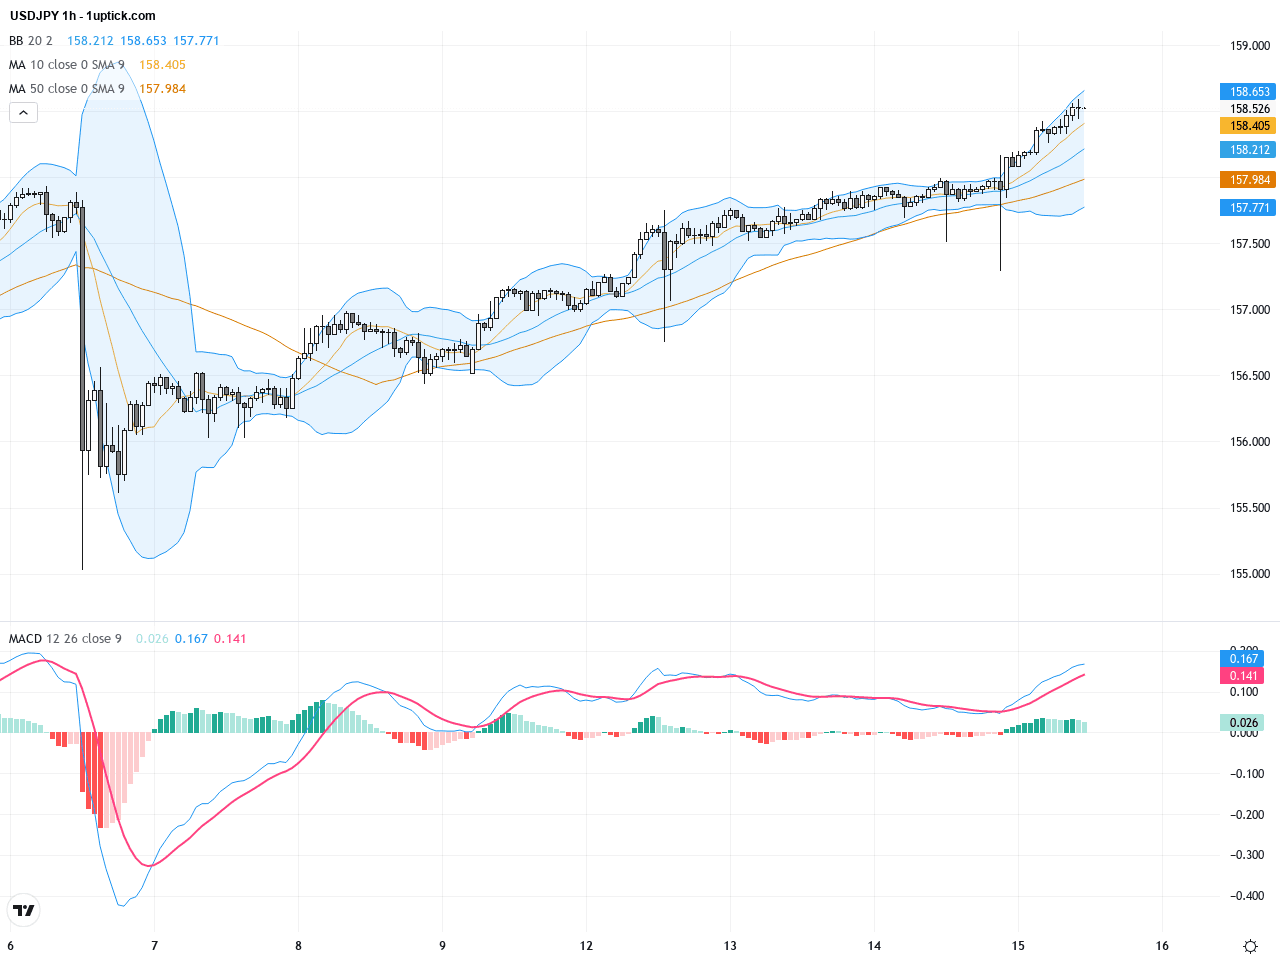
The hourly chart over the past 5 days reveals a volatile but generally upward movement in USDJPY, currently consolidating between 158.2 and 158.6. The 20 and 50-period moving averages have formed a bullish crossover, supporting short-term upside momentum. Bollinger Bands have tightened implying reduced volatility, while MACD has crossed upwards signaling potential near-term gains. Notably, a shooting star candlestick formed around 15:00 GMT+1 suggests potential short-term selling pressure. Traders should watch for price support levels.
Technical Trend: The short-term trend is a volatile upward movement with waning momentum, maintaining a cautiously bullish stance.
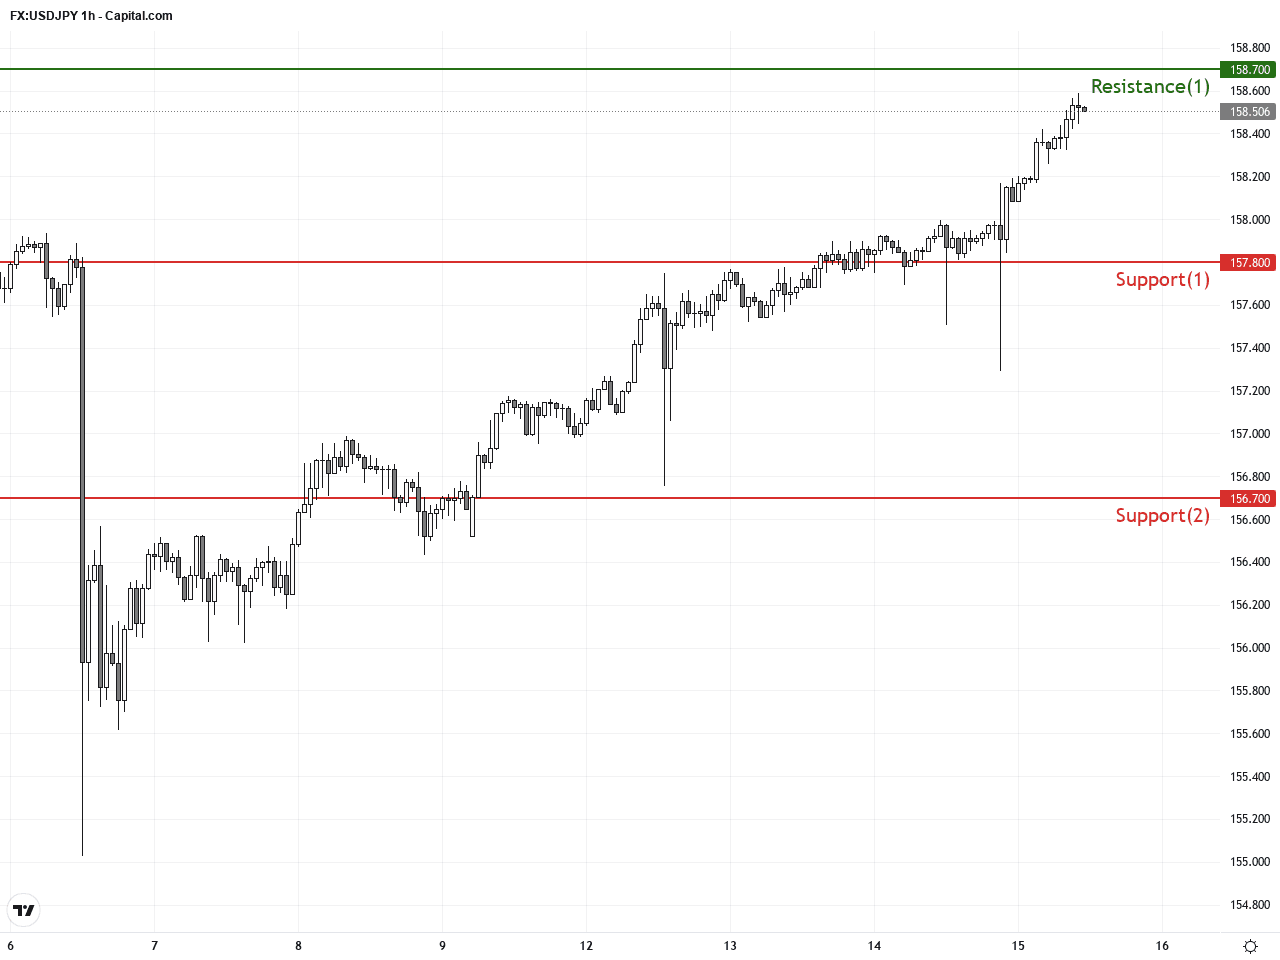
Technically, USDJPY is breaking out of an ascending wedge pattern that began forming in late April. A confirmed downside breakout may prompt a short-term corrective phase. The daily MACD divergence and the shooting star candlestick on the hourly chart signal potential short-term selling pressure. However, the 50-day moving average provides solid support. Traders should closely observe if the price holds above 157.8 to avoid deeper pullbacks.Today’s economic calendar in GMT+1 shows no major events directly impacting USDJPY. Key US and Japan data releases are absent today, though upcoming US industrial production and capacity utilization data may indirectly influence the dollar later. Stronger-than-expected US data would typically boost USDJPY, while disappointing figures could trigger pullbacks. Currently, the currency pair is mainly driven by fundamental news and BoJ policy outlook without direct economic event triggers.
Resistance & Support
The above financial market data, quotes, charts, statistics, exchange rates, news, research, analysis, buy or sell ratings, financial education, and other information are for reference only. Before making any trades based on this information, you should consult independent professional advice to verify pricing data or obtain more detailed market information. 1uptick.com should not be regarded as soliciting any subscriber or visitor to execute any trade. You are solely responsible for all of your own trading decisions.