


 |
| Gold V.1.3.1 signal Telegram Channel (English) |

EURUSD: Euro Slides Near Key Support 1.1650 as US Inflation Spurs Fed Rate Hike Expectations, May 15, 2026
2026-05-15 @ 09:01
Over the past 24 to 48 hours, the EUR/USD pair has seen a notable decline. Starting from yesterday’s closing price near 1.1655, the euro traded around 1.1660 during early sessions before dropping to a low near 1.1635, marking a decline of over 0.1%. This movement was primarily driven by fresh US inflation data, which remains elevated and has intensified market expectations for the Fed to continue hiking rates, thereby strengthening the US dollar and pressuring the euro.
With April’s US Consumer Price Index (CPI) projected to jump to 3.7%, the highest in nine months, market focus shifted towards the dollar as a safe haven. Additionally, disappointing US retail sales further dampened investor sentiment, preventing the euro from gaining strong buying support. Meanwhile, ongoing geopolitical tensions in the Middle East and rising oil prices have also boosted safe-haven demand for the US dollar.
For the average investor, these movements reflect heightened global sensitivity to US economic indicators. Strong inflation readings reinforce the Fed’s tightening bias, making the dollar an attractive asset, while the euro suffers from unclear ECB policy signals and geopolitical risks. In the short term, investors face heightened FX volatility due to the dollar’s strength and should stay alert to evolving US inflation data and global geopolitical developments that will continue to influence market dynamics.
The daily chart reveals a clear downtrend over the past week, as EURUSD steadily declined toward the 50-day (around 1.1660) and 200-day moving averages (around 1.1680), which are now acting as resistance. Bollinger Bands are narrowing, indicating reduced volatility, while the MACD hovers around the zero line, suggesting balanced but slightly bearish momentum. A mild descending triangle appears to form, suggesting potential further downside unless a decisive breakout above the moving averages occurs.
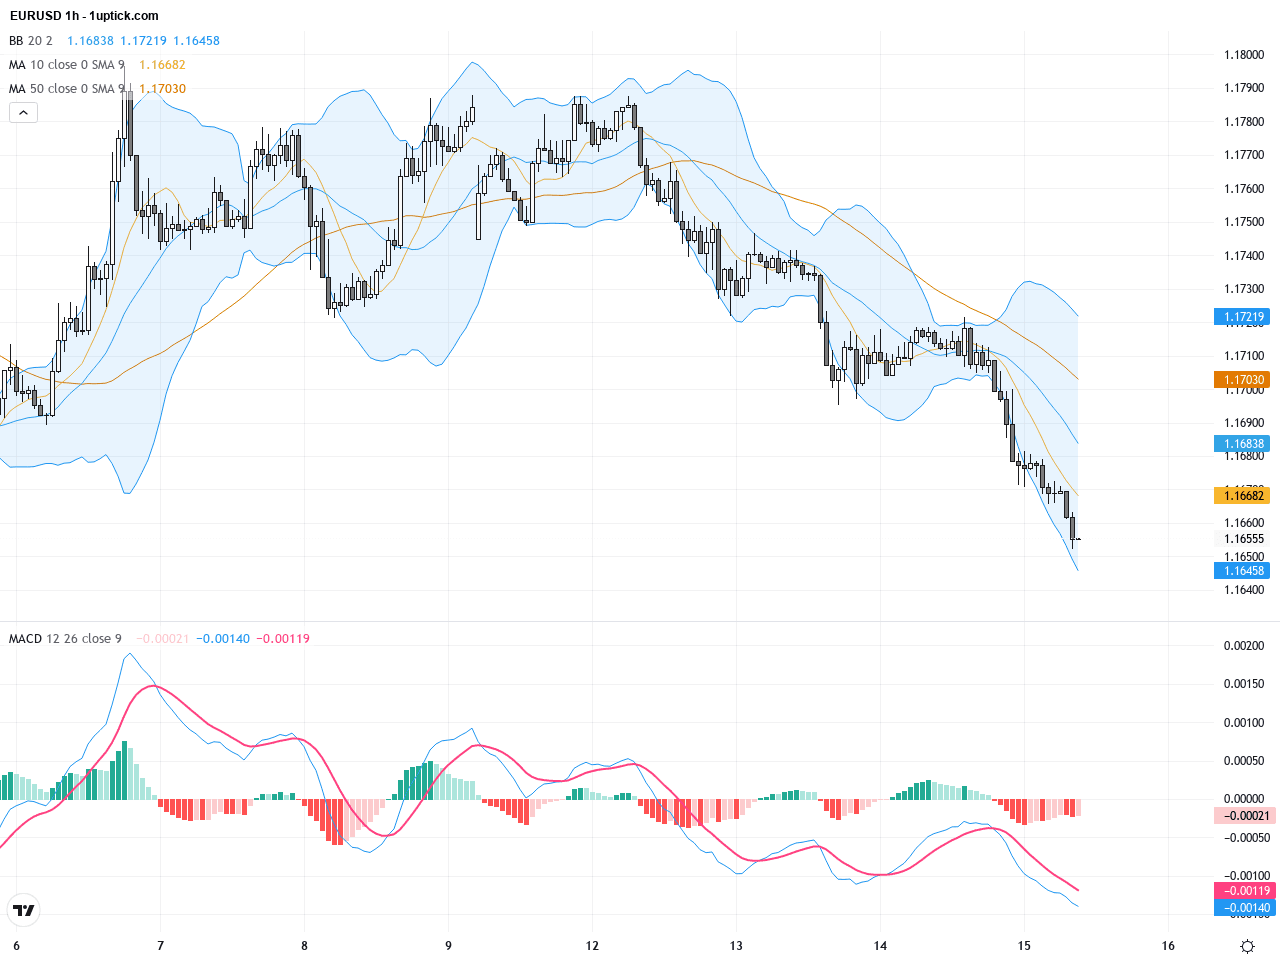
The hourly chart over the past 3-5 days shows EURUSD consolidating between 1.1650 and 1.1680. The middle Bollinger Band slopes downward, with short-term EMAs (5 and 10) in a bearish crossover. The MACD has just generated a bearish crossover (death cross), signaling weakening momentum. Early-session bearish engulfing candlestick suggests persistent selling pressure that may push prices down toward support levels in the short term.
Technical Trend: The current trend is cautiously bearish with low volatility and a consolidation pattern leaning downward in the short term.
Technically, EURUSD is near pivotal support at 1.1650. Failure to hold this level could expose the pair to a drop toward 1.1578. The MACD death cross and bearish hourly EMA cross warn of ongoing short-term downward momentum, while narrowing Bollinger Bands and unbroken daily moving averages present a key battleground. Traders should watch for a breakout above the daily moving averages to identify potential trend reversal or continuation.Today’s GMT+1 economic calendar features several important US events relevant to EURUSD, including speeches from multiple FOMC members and retail sales data which could reaffirm or alter expectations surrounding Fed policy. UK GDP and trade data releases will be less impactful on EURUSD directly. Generally, strong US data could bolster the USD and weigh on EURUSD, whereas weaker data may provide the euro a chance to rally.
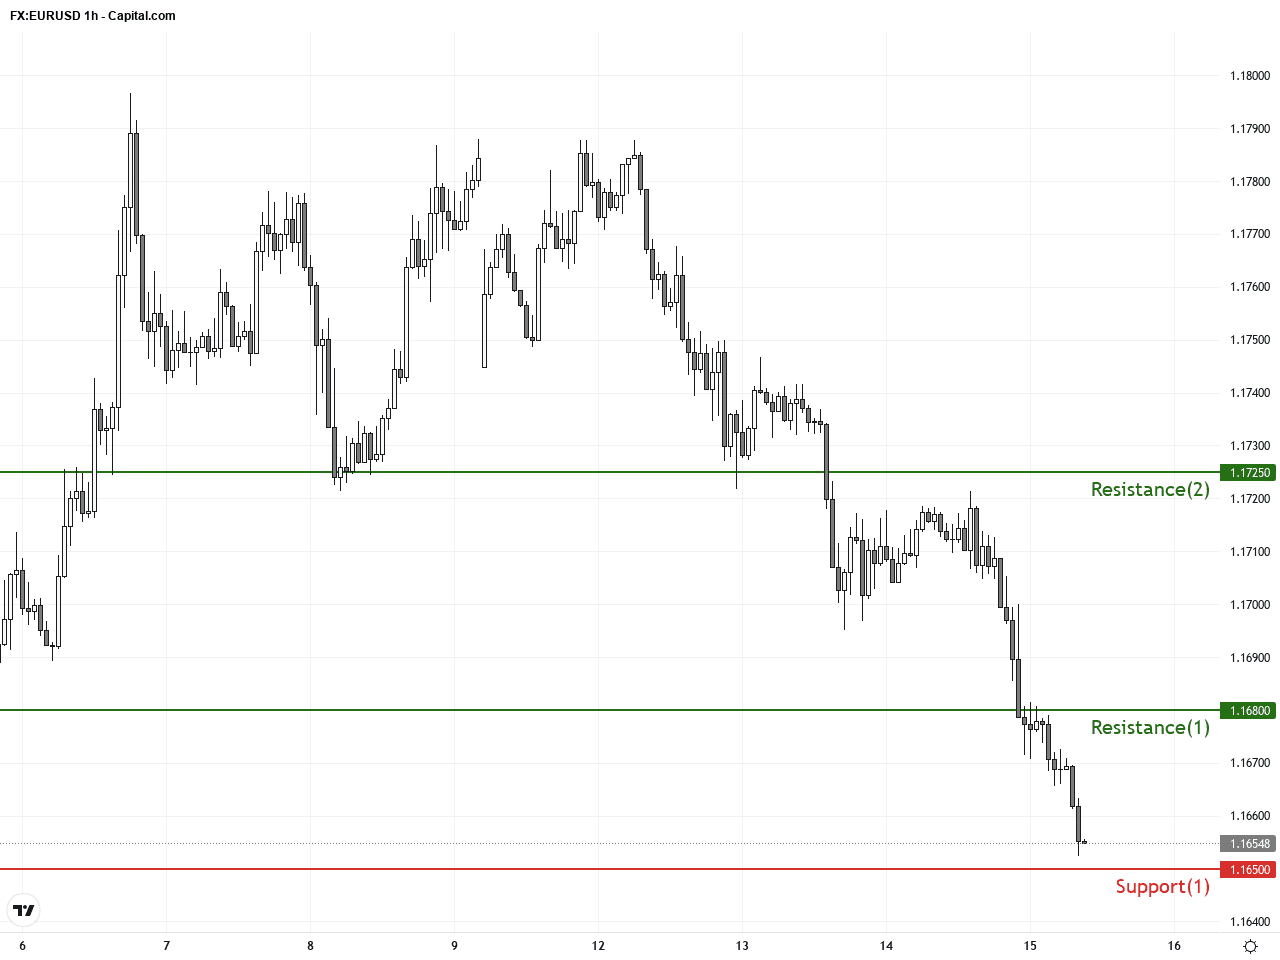
Resistance & Support
The above financial market data, quotes, charts, statistics, exchange rates, news, research, analysis, buy or sell ratings, financial education, and other information are for reference only. Before making any trades based on this information, you should consult independent professional advice to verify pricing data or obtain more detailed market information. 1uptick.com should not be regarded as soliciting any subscriber or visitor to execute any trade. You are solely responsible for all of your own trading decisions.