
 |
| Gold V.1.3.1 signal Telegram Channel (English) |
WTI Crude Oil: Key Support Holds as Technical Patterns Signal Potential for Volatility
2025-12-18 @ 08:01
Over the past 24 to 48 hours, WTI crude oil prices have shown a notable rebound, closing yesterday at $56.75, up significantly from $55.13 the day before. This rise was primarily driven by a series of market news, with the most impactful being former U.S. President Trump’s announcement of a total blockade on Venezuelan oil tankers. This blockade restricts the movement of sanctioned tankers, sharply reducing available oil supply and raising supply risks, which in turn pushed prices higher.
Meanwhile, oil production from major firms in Texas and New Mexico remained largely unchanged in the fourth quarter, signaling domestic market stability in the U.S. However, escalating global geopolitical risks have introduced uncertainty about future supply. This scenario helped WTI oil prices break away from several days of weakness, triggering a phase of recovery.
For the average investor, this means that despite seemingly ample global supply, regional supply tightness and sudden political events act as a warning signal. These factors remind markets and investors to be cautious of potential price volatility and further price increases. Local tensions and policy shifts directly affect energy costs, urging investors to closely monitor news developments and adjust their strategies accordingly.

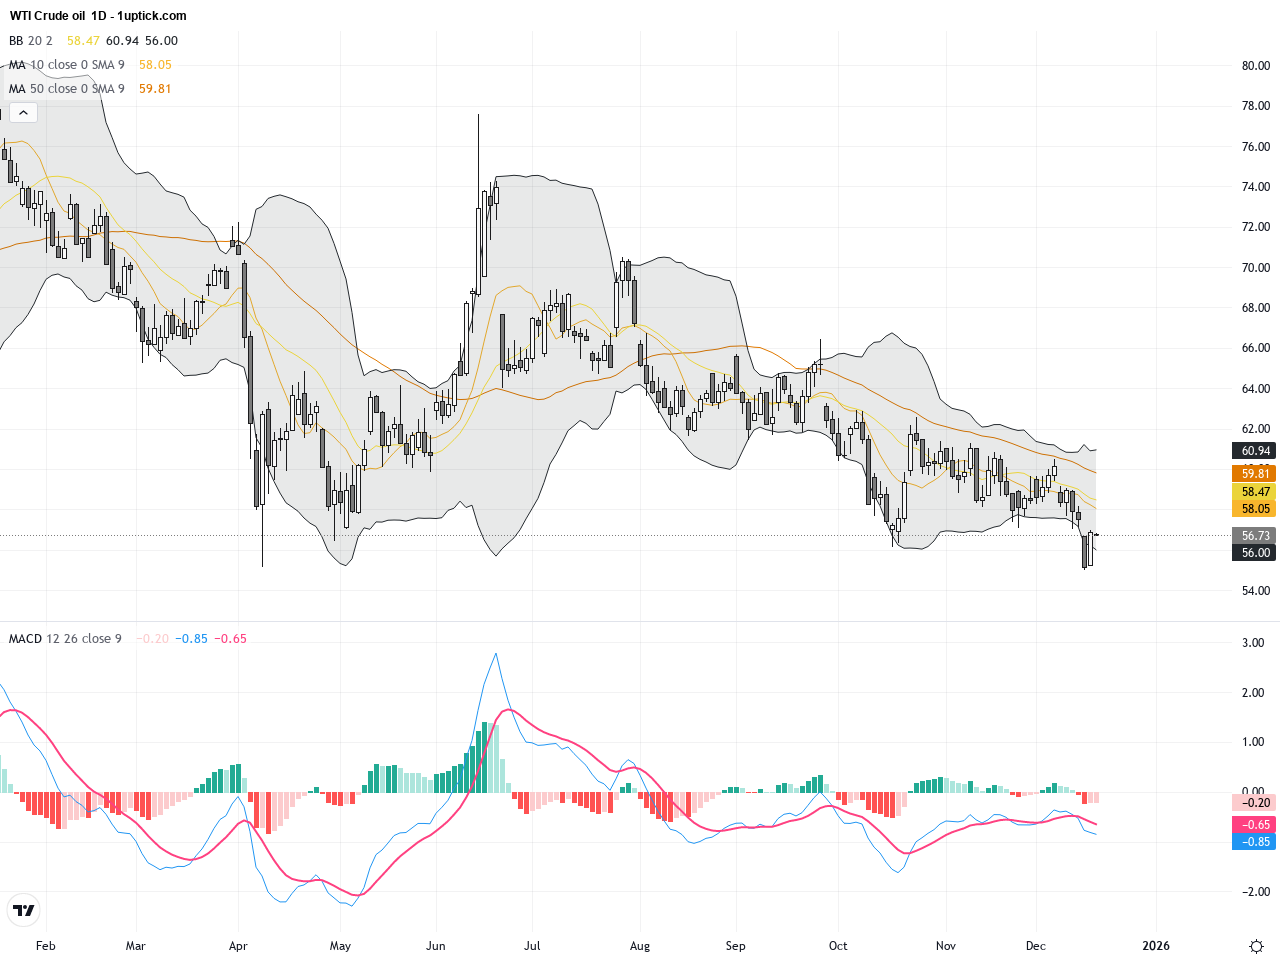
The daily chart reveals that WTI crude oil has been range-bound between approximately 56 and 58 USD since early December, retreating from earlier highs near 58 USD. Bollinger Bands are narrowing, indicating declining volatility, while the 20-day moving average is positioned near current prices acting as resistance. The MACD shows weakening bullish momentum with a potential bearish crossover looming, suggesting short-term downward pressure. Overall, the trend is sideways consolidating, awaiting clear signals for the next directional move.
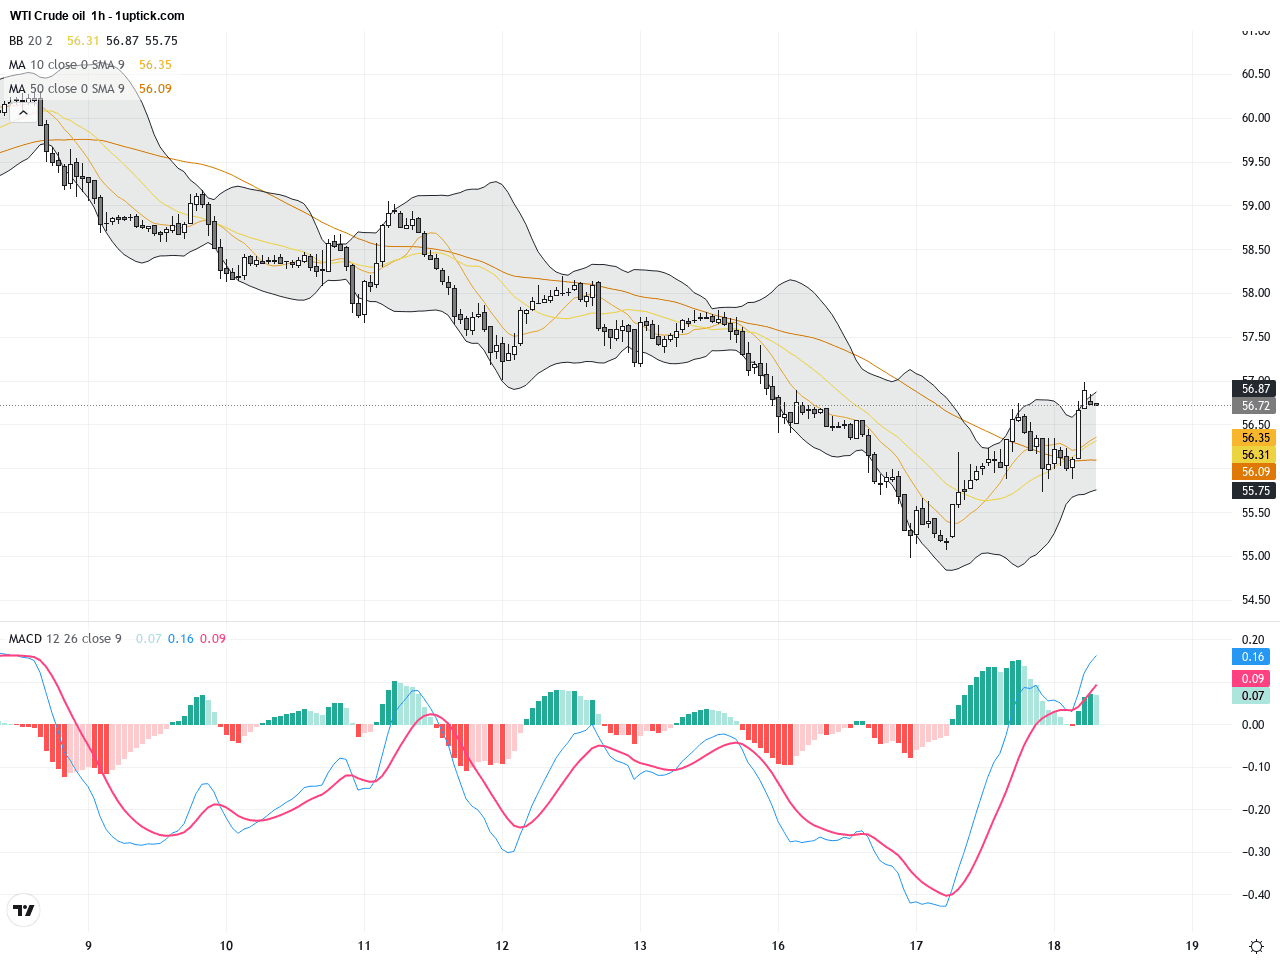
Examining the last 3-5 days on the hourly chart, WTI prices fluctuate between 56.5 and 57 USD, forming a consolidation zone. Short-term moving averages show a bullish alignment but prices oscillate around the 20 and 50 periods moving averages. A recent MACD bullish crossover hints at improving short-term momentum. Bollinger Bands are slightly widening, suggesting potential upcoming increase in price volatility. Traders should watch for decisive breaks above resistance or below support to confirm trend direction.
Technical Trend: WTI Crude Oil is currently in a cautiously sideways trend, with prices expected to oscillate within key support and resistance zones in the short term.
Technical analysis shows daily Bollinger Bands contraction alongside MACD momentum fading, indicating a likely continuation of sideways movement. The hourly MACD bullish crossover suggests possible short-term bounce if WTI can break above the resistance near 56.9 USD. A break below the 56 USD support could open the door for further downside. Monitoring volume trends will be key to identify high-probability entry points.There are no significant economic releases today directly impacting WTI Crude Oil prices. Market focus remains on geopolitical developments and US energy production updates. Traders should monitor for any shifts in supply-demand fundamentals especially related to US and Venezuelan policies.
Resistance & Support

The above financial market data, quotes, charts, statistics, exchange rates, news, research, analysis, buy or sell ratings, financial education, and other information are for reference only. Before making any trades based on this information, you should consult independent professional advice to verify pricing data or obtain more detailed market information. 1uptick.com should not be regarded as soliciting any subscriber or visitor to execute any trade. You are solely responsible for all of your own trading decisions.