Gold and Silver Price Forecast 2025: How Dollar Strength and Risk-Off Flows Impact Metals Momentum and Investor Strategy

Gold and silver prices are projected to experience significant momentum through 2025 and beyond, driven by a mix of dollar strength, risk-off investor flows, and robust industrial demand. Gold is forecasted to rise, with prices expected to average around $3,600 to $3,700 per ounce by the end of 2025, potentially reaching $4,000 by mid-2026 as central banks and geopolitical tensions drive safe-haven buying. Silver shows even stronger upside potential, with forecasts generally targeting $40 per ounce in 2025 and possible levels above $50 by 2026, fueled by growing demand from green technologies like solar energy and electric vehicles, alongside supply constraints.

Investors should focus on key factors shaping metals momentum: the pace of industrial adoption, monetary policy effects on the dollar, global political risks, and shifting supply dynamics from major producers. While some analysts forecast silver reaching $65 or higher by 2026 and gold pushing toward new all-time highs, market volatility remains possible. This environment suggests a strategic opportunity for investors to consider precious metals as a hedge against inflation and financial uncertainty, capitalizing on the evolving interplay between dollar fluctuations and risk-off market behavior.

Optimizing precious metals investment strategies in 2025 involves monitoring dollar trends, industrial demand growth, and geopolitical developments, which together are set to influence gold and silver prices markedly in the coming years.

USDJPY: Key Resistance Builds Pressure Amid Sideways Consolidation, Short-Term Pullback Possible

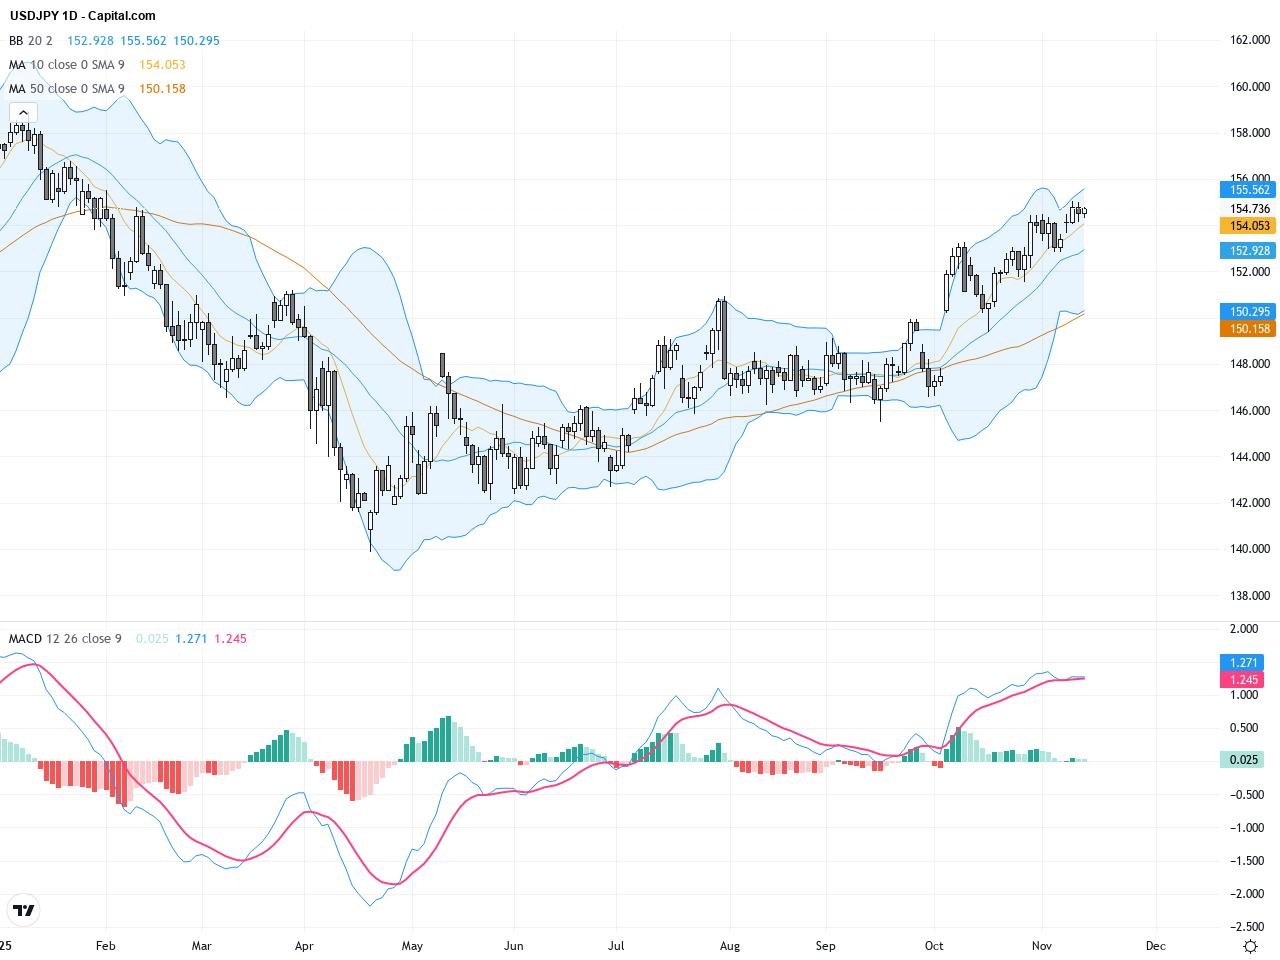
Over the past three trading days, USDJPY has oscillated within a narrow range between 154.3 and 154.7, closing at 154.723 yesterday. The currency pair remains strong but is struggling to break out decisively. With no major market news driving the price this week, the mild upward move stems mainly from persistent USD demand. Poor Chinese economic data coupled with ongoing yen weakness has led investors to adopt a cautious trading stance. For average investors, USDJPY is currently revisiting its support and resistance levels, suggesting a continuation of sideways consolidation in the short term. Close monitoring of technical signals is essential for upcoming trading decisions.

Gold Prices Surge Beyond $4,200: Key Drivers, Technical Outlook, and What to Watch in Late 2025

# Gold Prices Surge Beyond $4,200: Key Drivers, Technical Outlook, and What to Watch in Late 2025

Gold has reached impressive levels in mid-November 2025, with prices climbing beyond the $4,200 mark as the precious metal extends its remarkable rally. On November 13th, gold established intraday highs near $4,239.52 per ounce, marking the fifth consecutive trading session of gains and reflecting a dramatic reversal from the corrections experienced in late October. This surge represents a 7% jump over just five sessions, reinstating gold’s position among the best-performing assets and signaling renewed investor confidence in the metal’s long-term prospects.

## What’s Driving Gold’s Powerful Rally?

Gold’s extraordinary performance in 2025 stems from a potent combination of macroeconomic and geopolitical factors. Persistent sticky inflation continues to erode real asset values, making gold an essential hedge against purchasing power deterioration. Simultaneously, escalating geopolitical uncertainty has prompted investors worldwide to seek safe-haven assets, with gold consistently attracting capital during periods of global systemic risk. The broader de-dollarization trend has further supported demand, as central banks and institutional investors diversify away from traditional currency reserves into precious metals.

The momentum behind this rally is substantial, with massive capital inflows into gold ETFs validating the structural tailwinds supporting prices. These factors have collectively proven powerful enough to overcome the traditional headwind of elevated US interest rates, which typically suppress gold demand by increasing the opportunity cost of holding non-yielding assets.

## Technical Landscape and Near-Term Price Targets

From a technical perspective, gold’s recovery has been decisive. The metal bounced off the critical $3,900 support level near the 50-day moving average and has successfully reclaimed its short-term uptrend for the first time in nearly two weeks. With momentum indicators improving and the Relative Strength Index rising, the technical setup appears bullish in the immediate term.

The next major resistance zone sits at $4,160 to $4,180, where sellers previously staged defensive stands. A successful close above this level would likely confirm that the uptrend has sustainably resumed, potentially opening the door for advances toward $4,250 to $4,300—levels that represent the October peak. Some analysts suggest that continued strength could eventually push prices toward a $4,400 retest, contingent upon maintaining momentum and positive sentiment.

## Key Support and Resistance Levels to Monitor

For traders and investors, several price levels warrant close attention:

**Resistance zones** include the immediate barrier at $4,160 to $4,180, followed by the significant October peak around $4,250 to $4,300. **Support areas** are anchored at $3,900 to $3,880 near the 50-day moving average, with intermediate support at $3,750 and the 200-day moving average providing deeper support near $3,396.

## What Could Go Wrong? Risks to Monitor

Despite the bullish short-term setup, investors should remain aware of potential headwinds. Technical analysis reveals that momentum indicators for gold are deeply overbought, signaling that a sharp, near-term correction remains a possibility. The Commitment of Traders report presents a contrarian warning, with speculators positioned at extreme bullish levels while commercial hedgers sit at extreme bearish positions—a configuration historically associated with market reversals.

A breakdown below the $3,880 support level could trigger a retest of $3,750, particularly if dollar strength accelerates or yields spike sharply. However, current technical strength suggests this downside scenario remains unlikely in the near term, with probability estimates suggesting only a 15% chance of such a decline over the next two to three weeks.

## Probability Scenarios for Late 2025

Looking ahead, analysts project several potential outcomes. Continuation higher toward $4,180 to $4,250 carries the highest probability at approximately 55%, supported by improving momentum above the 50-day moving average and rising RSI. Consolidation between $3,900 and $4,150 remains possible at around 30% probability, representing a short-term pause after the strong rebound. The breakdown scenario below $3,880 toward $3,750 accounts for roughly 15% probability, materializing primarily if dollar strength returns or yields experience significant upward pressure.

## The Long-Term Outlook: A “Golden Age” Ahead

While short-term corrections remain possible, the broader structural backdrop supports a multi-year bull market for gold. The combination of persistent inflation, geopolitical risks, and de-dollarization trends suggests robust, sustained demand. This long-term bullish trend indicates that investors should view near-term weakness as potential buying opportunities rather than reversals of the primary trend.

As gold navigates the remainder of 2025, staying informed about macroeconomic developments, geopolitical events, and technical price levels will be essential for both active traders and long-term investors seeking to capitalize on the precious metal’s historic rally.


Gold Price Forecast 2025: Navigating Volatility as XAU/USD Approaches Record Highs

Gold Price Forecast 2025 highlights a dynamic year as gold (XAU/USD) approaches historic highs amid global economic uncertainty and geopolitical tensions. Experts predict gold prices ranging broadly from $3,000 to over $5,000 per ounce by mid-2026, driven by factors such as sustained central bank buying, inflation concerns, and investor demand for safe-haven assets. The market is expected to see volatility, with consensus forecasts suggesting a consolidation phase around $4,200-$4,500 in late 2025 before potentially climbing towards $5,000. This surge is supported by low interest rates and ongoing geopolitical risks, making gold an attractive store of value and portfolio diversifier. Investors are advised to monitor monetary policies, global trade developments, and risk sentiment closely to navigate the gold market effectively in 2025 and beyond. Strategic positioning in gold mining equities and options trading may enhance growth potential in this bullish phase. Overall, 2025 is shaping up as a pivotal year for gold, setting the stage for a new era of precious metal appreciation.

Gold and Silver Prices Face Correction as US Dollar Rebounds: November 2025 Market Outlook

Gold and silver prices are experiencing a market correction as the US dollar strengthens in November 2025, presenting both challenges and opportunities for investors. Despite the recent pullback, experts suggest limited downside risk for gold and silver, with potential catalysts including economic data releases and shifts in Federal Reserve policies such as the end of quantitative tightening and possible renewed quantitative easing. Analysts forecast continued industrial demand growth for silver, supporting its price alongside gold’s appeal as a safe-haven asset. Market conditions indicate a promising margin of safety for precious metals, with demand remaining resilient amid volatility. Stay informed on price triggers and market trends to navigate the evolving precious metals landscape effectively.

GBPUSD: Bullish Breakout Targets Key Resistance – Technical Momentum Signals Trading Opportunity

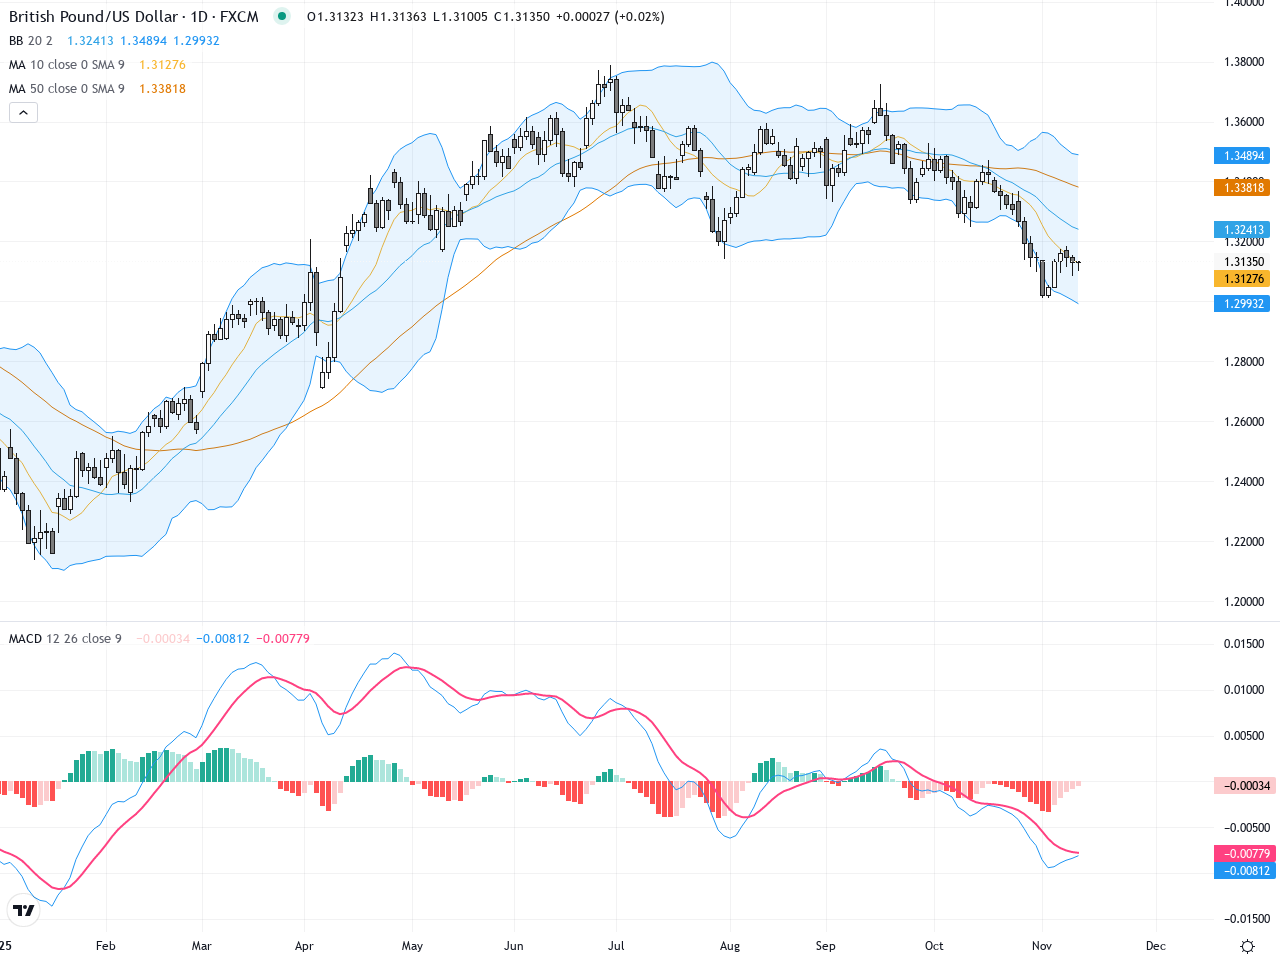
Over the past three trading days, GBPUSD has demonstrated clear volatility with a sharp upward bias, climbing towards the 1.31349 region—firmly above yesterday’s closing level. Despite a lack of high-impact news headlines, recent UK economic data and shifting US inflation expectations have been swiftly priced in, sparking stronger demand for the pound. For active traders, this week’s price action has felt like a tug-of-war: profits realized in the surge, but also wariness that any failure to break higher could lead to a swift retracement. So far, bullish technicals are in control, but the current GBPUSD price analysis hinges critically on whether buyers can decisively clear overhead resistance zones. Prudent risk management is a must as momentum builds.

Gold Price Surges Above $4,200: Key Drivers Behind the Rally and What’s Next

Gold prices have surged above $4,200 per ounce, marking a historic rally driven by strong bullish momentum, expectations of Federal Reserve interest rate cuts, and central bank buying in emerging markets. After breaking multiple all-time highs in October 2025, gold reached a peak of $4,378 before consolidating near $4,200. This rally reflects growing investor demand for safe-haven assets amid economic uncertainties, including inflation trends, government shutdown resolutions, and geopolitical factors. Experts project gold could surpass $5,000 per ounce next year, supported by ongoing central bank purchases and market dynamics. This significant upward trend highlights gold’s appeal as a hedge and valuable investment in volatile times.

Gold Prices Surge Past $4,130: Key Levels and What to Expect Next for XAU/USD

Gold prices have reached unprecedented levels, surging past $4,130 per ounce as growing economic uncertainty and shifting monetary policy expectations drive safe-haven demand. On November 12, 2025, spot gold trading reached $4,168.44 per ounce, marking a significant advance in what has been an exceptional year for precious metals.

The surge in gold prices is underpinned by several macroeconomic factors that continue to support bullish momentum. Weak U.S. economic data, including a decline in consumer sentiment to near record lows and notable job losses in October, have intensified expectations for Federal Reserve rate cuts. Traders are currently pricing in approximately a 64 percent probability of a 25-basis-point rate cut in December, with some Fed officials advocating for even larger reductions. A weaker U.S. dollar index, which declined to 103.9, has further bolstered hard asset prices as investors seek alternative stores of value.

Safe-haven demand remains a primary driver of gold’s strong performance, with geopolitical tensions and central bank buying from emerging markets providing sustained support. The resolution of the 42-day U.S. government shutdown, while potentially reducing some fiscal uncertainty, has not deterred investors from maintaining precious metal positions. Year-to-date performance demonstrates the strength of this trend, with gold advancing 58 percent compared to the same period last year.

Looking ahead, market analysts project substantial upside potential for gold prices. JP Morgan Private Bank has forecasted that gold could surpass $5,000 per ounce in the coming year, supported primarily by continued central bank purchases in emerging markets. This projection reflects confidence in the fundamental factors supporting precious metal valuations despite near-term volatility.

For traders and investors monitoring XAU/USD, the psychological level of $4,200 represents an important technical threshold to watch, with the recent all-time high of $4,381.58 established in October serving as the ultimate resistance level. Understanding these key price levels and the underlying economic drivers remains essential for making informed decisions in the precious metals market.

Gold Prices Surge Above $4,000: Technical Analysis, Support Levels, and Bullish Outlook for November 2025

Gold prices have surged above the $4,000 mark, driven by ongoing US economic concerns and a weakening dollar, creating a bullish outlook for November 2025. Technical analysis shows gold consolidating near $4,050, with strong support at $4,000 and resistance levels around $4,100 and $4,200, indicating potential further gains if bullish momentum continues. Despite a recent pullback from the $4,400 highs earlier in the year, gold maintains a solid upward trend with key moving averages supporting price stability and providing critical support zones. This surge is influenced by factors such as the US government shutdown and Federal Reserve rate cuts, contributing to cautious investor sentiment and increased demand for gold as a safe-haven asset. Traders should watch for key technical indicators like the Alligator indicator and moving averages to gauge the next moves in gold prices as consolidation unfolds following a strong rally.

Gold Price Outlook: Key Retracement Zone Between $4,133.95–$4,192.36 Could Shape Next Major Move

Gold prices are currently navigating a critical retracement zone between $4,133.95 and $4,192.36, which could determine the next significant market move. After a strong rally approaching $3,990, gold is poised for a potential bearish correction testing support near $3,865, before possibly resuming an upward trend targeting levels above $4,795. The relative strength index (RSI) and price action within an ascending channel are key indicators signaling whether the bullish momentum will continue or if a breakdown below $3,535 could lead to further declines toward $2,815. Recent price patterns show gold taking a breather following a short-term decline, reflecting market uncertainty around the USD Index’s rally. Investors are advised to watch these technical levels closely as they will likely shape gold’s next major price direction amid ongoing geopolitical and economic factors influencing demand for this safe-haven asset.

1uptick Analytics @

Risk Warning​

*Investment involves risk. You may use the information, strategies and trading signals on this website for academic and reference purposes at your own discretion. 1uptick cannot and does not guarantee that any current or future buy or sell comments and messages posted on this website/app will be profitable. Past performance is not necessarily indicative of future performance. It is impossible for 1uptick to make such guarantees and users should not make such assumptions. Readers should seek independent professional advice before executing a transaction. 1uptick will not solicit any subscribers or visitors to execute any transactions, and you are responsible for all executed transactions.

© 2022-26 1uptick Analytics all rights reserved.


Risk Warning​

*Investment involves risk. You may use the information, strategies and trading signals on this website for academic and reference purposes at your own discretion. 1uptick cannot and does not guarantee that any current or future buy or sell comments and messages posted on this website/app will be profitable. Past performance is not necessarily indicative of future performance. It is impossible for 1uptick to make such guarantees and users should not make such assumptions. Readers should seek independent professional advice before executing a transaction. 1uptick will not solicit any subscribers or visitors to execute any transactions, and you are responsible for all executed transactions.

© 1uptick Analytics all rights reserved.

Home
.AI
Analysis
Calendar
Tools