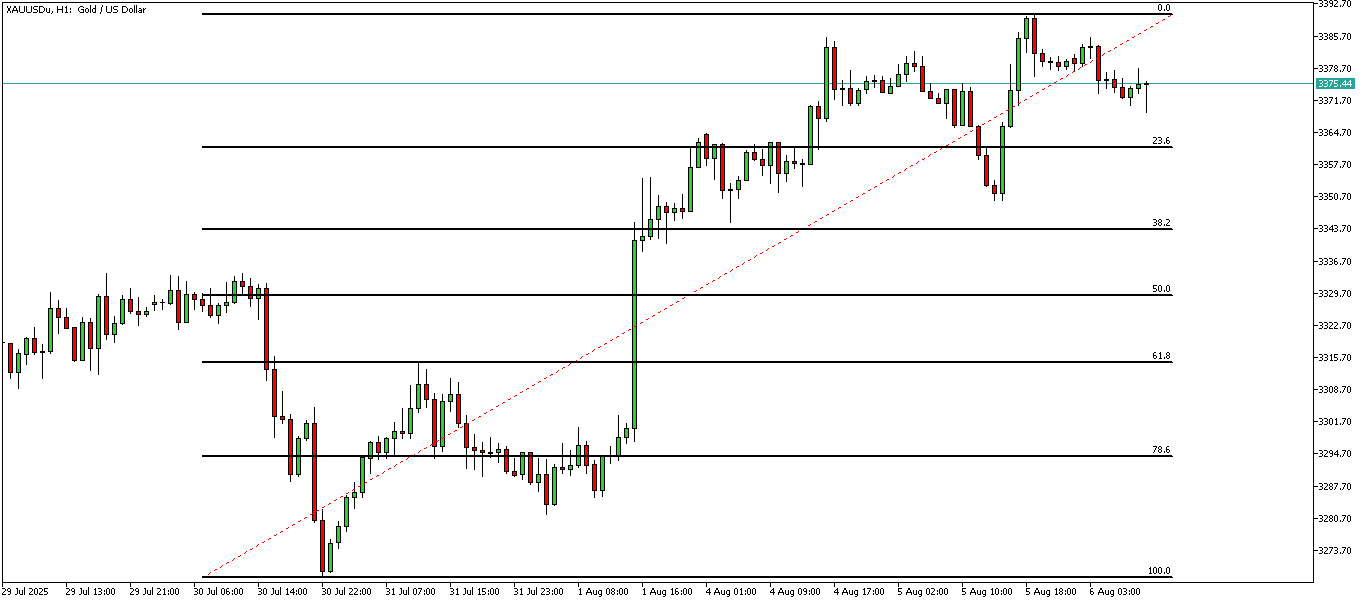
XAUUSD-1 hour

Market Overview Gold (XAUUSD) traded in a volatile range over the past week, initially dropping below $3,300/oz after breaking down from a technical triangle pattern, reaching lows near $3,270/oz. The selloff followed a bearish monthly candle closure, signaling momentum was shifting toward sellers. However, gold quickly rebounded as support emerged at the 100-day moving average, […]

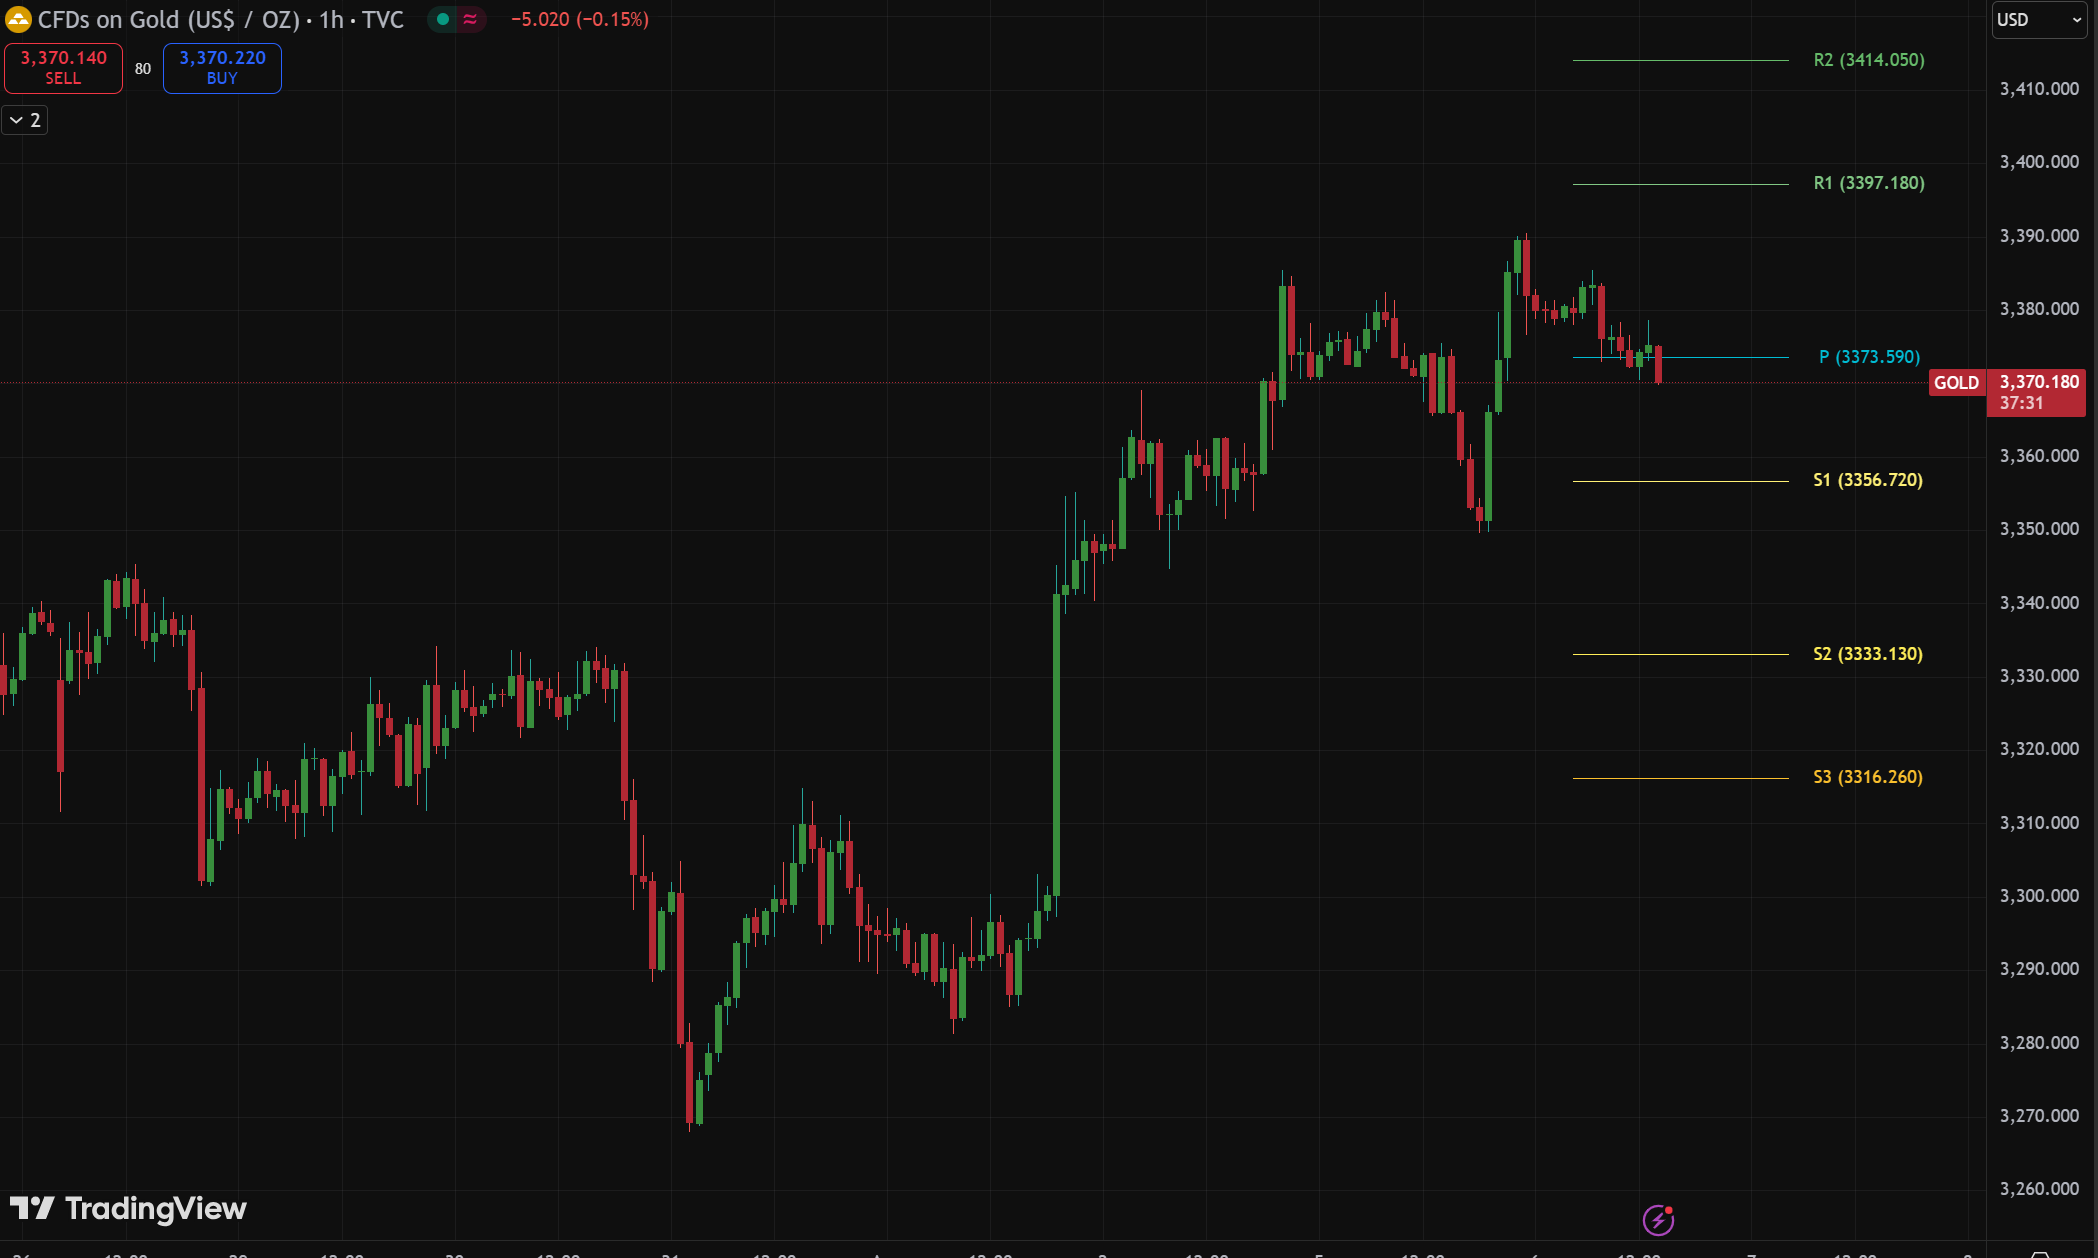
XAUUSD-1 hour

Market Overview Gold (XAUUSD) experienced volatile movement over the past week, trading between $3,270 and $3,400 per ounce. After a brief dip, bullish momentum returned as weak US Nonfarm Payrolls data increased expectations of a Federal Reserve rate cut in September, weakening the dollar and supporting gold prices. Technical indicators show gold rebounding from key […]

Gold Price Pullback Explained: Key Support Levels, Forecasts, and What Investors Should Watch in 2025

Gold prices in 2025 are expected to experience a pullback after strong gains in the first half of the year, with key support levels around $2,500 to $2,530. Influenced heavily by US Federal Reserve policies, geopolitical tensions, and central bank demand, gold’s performance will depend on developments such as inflation trends, global conflicts, and economic conditions. Forecasts suggest a sideways to moderately bullish outlook, with potential price targets ranging from $2,400 on the downside to possibly reaching $3,000 to $3,675 by the end of 2025. Investors should monitor Fed decisions, geopolitical events, and central bank buying patterns to navigate gold’s volatility effectively. Safe-haven demand remains a critical factor, especially amid ongoing economic uncertainties and trade tensions.

Gold Prices Show Bullish Momentum Amid Fed Rate Cut Expectations and Weaker Dollar

Gold prices are showing strong bullish momentum driven by expectations of Federal Reserve rate cuts and a weaker US dollar. Leading financial institutions forecast gold to reach new record highs, with price targets ranging from around $3,500 to $3,700 per ounce by the end of 2025, and projections reaching near $4,000 per ounce in early 2026. This upward trend is fueled by increased demand from central banks, investors seeking safe-haven assets amid economic uncertainty, geopolitical risks, and potential recessions. As market volatility continues, gold remains a preferred asset for diversification and protection against currency depreciation, making it a key focus for traders and investors heading into 2025 and beyond.

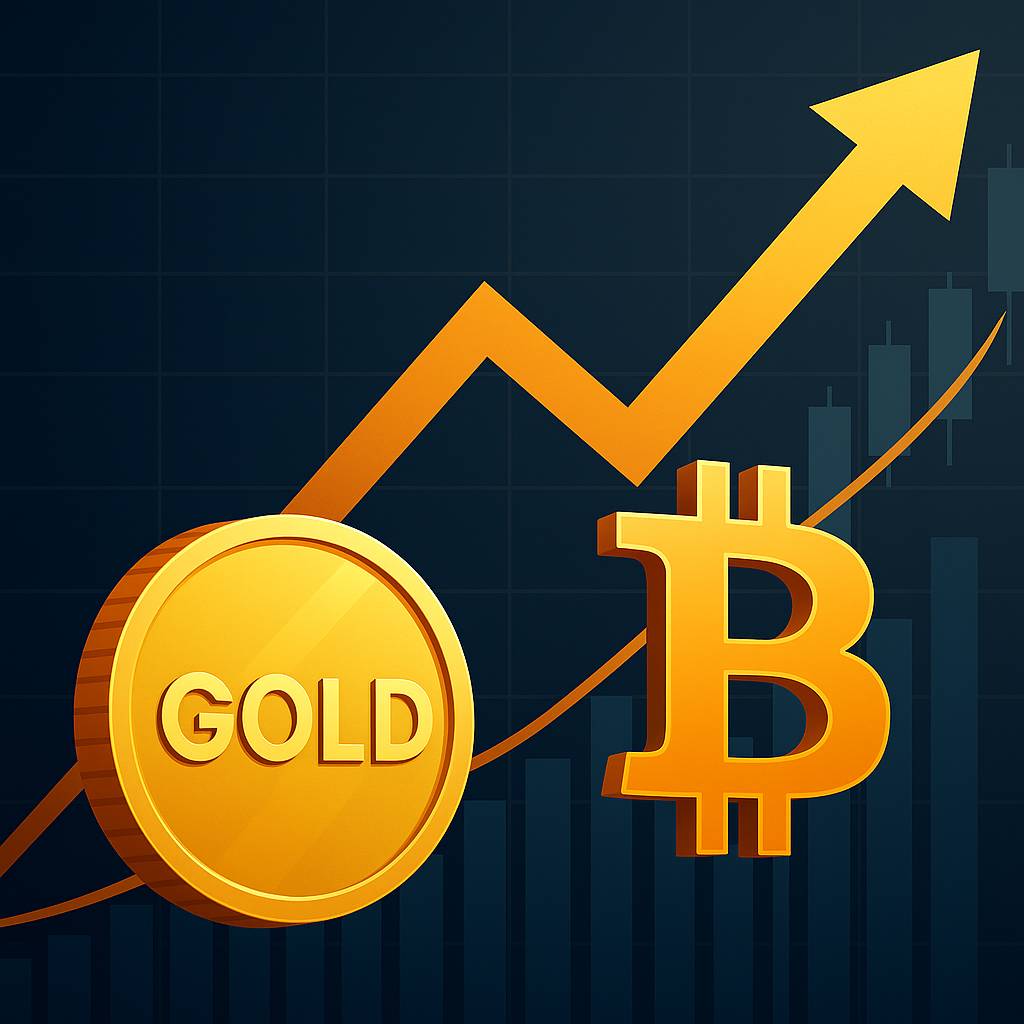
Gold vs Bitcoin: Comparing Stability and Potential as Stores of Value in Today’s Market

Bitcoin and gold are two leading stores of value, each with distinct advantages and challenges in today’s market. Gold boasts a proven track record spanning thousands of years, with widespread societal acceptance, physical utility, and relative price stability. However, its supply grows by around 1.5–2% annually, and it is cumbersome to transport and divide for transactions. Bitcoin, often called digital gold, offers absolute scarcity with a capped supply of 21 million coins, high portability, easy divisibility, and fast borderless transfers with minimal fees. While Bitcoin’s volatility remains higher and it depends on digital infrastructure, its usability, scarcity, and verifiability continue to strengthen its investment potential. Investors weigh gold’s physical nature and historical reliability against Bitcoin’s innovative digital advantages, making both assets compelling choices depending on risk tolerance and financial goals.

Gold and Silver Prices Soar in 2025 Amid Fed Rate Cut Expectations and Economic Uncertainty

Gold and silver prices are soaring in 2025 amid expectations of Federal Reserve rate cuts and ongoing economic uncertainty. Gold has reached record highs, with forecasts predicting averages around $3,675 per ounce by late 2025 and a potential rise to $4,000 per ounce by mid-2026, driven by geopolitical risks, market volatility, and sustained central bank buying. Silver is also benefiting from strong industrial demand, especially in solar and electric vehicle sectors, and is expected to trade above $35 per ounce, with some analysts projecting even higher prices due to supply deficits and a favorable gold-to-silver price ratio. This precious metals rally reflects investors’ search for safe-haven assets amid global economic headwinds and trade policy uncertainty.

Gold Price Outlook August 2025: Key Support, Resistance, and Impact of Tariffs and Fed Rate Expectations

Gold prices are expected to show mixed movement in August 2025, with forecasts indicating potential gains tempered by risks of decline or stagnation. Key support and resistance levels will shape this outlook, influenced significantly by ongoing tariff developments and Federal Reserve interest rate expectations. Analysts predict gold could begin the month around $2,624 per ounce, with highs possibly approaching $2,863, while volatility remains likely due to market uncertainties. Investors are advised to focus on gold’s long-term portfolio protection benefits rather than short-term price fluctuations, given the metal’s historical role as a hedge against inflation and economic uncertainty. Understanding these factors can help position investors to navigate August’s gold market dynamics effectively.

Gold Price Surge to $3,400/oz: Fed Rate Cut Speculation Fuels Bullish Rally

Gold prices have surged to $3,400 per ounce, driven by speculation of upcoming Federal Reserve rate cuts and ongoing economic uncertainties. This bullish rally reflects increased investor demand amid concerns over inflation, geopolitical risks, and potential recession, positioning gold as a key safe-haven asset in 2025. Market forecasts now suggest gold could rise further, with some experts predicting prices approaching $4,000 per ounce by 2026, fueled by persistent trade tensions and structural shifts in demand. For investors seeking portfolio stability amid volatile markets, gold remains a strategic choice offering both protection and growth potential.

Gold Price Outlook: Key Support, Resistance Levels, and How US Economic Data Is Driving Volatility

Gold price in 2025 is poised for significant volatility driven by key support and resistance levels and influenced heavily by US economic data. Analysts project gold prices to trade between $3,300 and $3,600 in the short term, with expectations of reaching new record highs due to ongoing inflation challenges, a weakening dollar, and economic instability in the US. Long-term forecasts remain bullish, with predictions suggesting gold could approach $3,500 by the end of 2025 and potentially rise above $5,000 by 2030. Investors should watch closely how upcoming US economic reports and trade policies impact gold’s performance, as these factors are critical in driving price fluctuations and investment opportunities in this precious metal market.

Gold Prices at Critical Junction: Key Technical Levels and Market Factors to Watch Near $3,300/Oz

Gold prices are at a critical juncture near the $3,300 per ounce mark, facing key technical levels that could determine the next major move. Currently consolidating just below all-time highs around $3,510, gold is testing its 50-day moving average and an ascending trendline that has supported its 2025 rally. Momentum indicators, like the RSI, show weakening strength, signaling a potential pause or pullback if support levels break. However, as long as these technical supports hold, the broader uptrend remains intact. Market factors such as expectations of Federal Reserve rate cuts, geopolitical tensions, and safe-haven demand amid trade uncertainties continue to influence gold’s price action. Traders should watch resistance near $3,420 and support around $3,340 to $3,270 for clues on whether gold will resume its rally or enter a correction phase. This consolidation period is crucial, as a decisive move above or below these levels will set gold’s trajectory in the coming weeks.

1uptick Analytics @

Risk Warning​

*Investment involves risk. You may use the information, strategies and trading signals on this website for academic and reference purposes at your own discretion. 1uptick cannot and does not guarantee that any current or future buy or sell comments and messages posted on this website/app will be profitable. Past performance is not necessarily indicative of future performance. It is impossible for 1uptick to make such guarantees and users should not make such assumptions. Readers should seek independent professional advice before executing a transaction. 1uptick will not solicit any subscribers or visitors to execute any transactions, and you are responsible for all executed transactions.

© 2022-26 1uptick Analytics all rights reserved.


Risk Warning​

*Investment involves risk. You may use the information, strategies and trading signals on this website for academic and reference purposes at your own discretion. 1uptick cannot and does not guarantee that any current or future buy or sell comments and messages posted on this website/app will be profitable. Past performance is not necessarily indicative of future performance. It is impossible for 1uptick to make such guarantees and users should not make such assumptions. Readers should seek independent professional advice before executing a transaction. 1uptick will not solicit any subscribers or visitors to execute any transactions, and you are responsible for all executed transactions.

© 1uptick Analytics all rights reserved.

Home
.AI
Analysis
Calendar
Tools