


 |
| Gold V.1.3.1 signal Telegram Channel (English) |

AUDUSD: Key 0.6700 Support Tested Amid Consolidation Signs – Trading Outlook & Technical Patterns
2026-01-14 @ 05:28
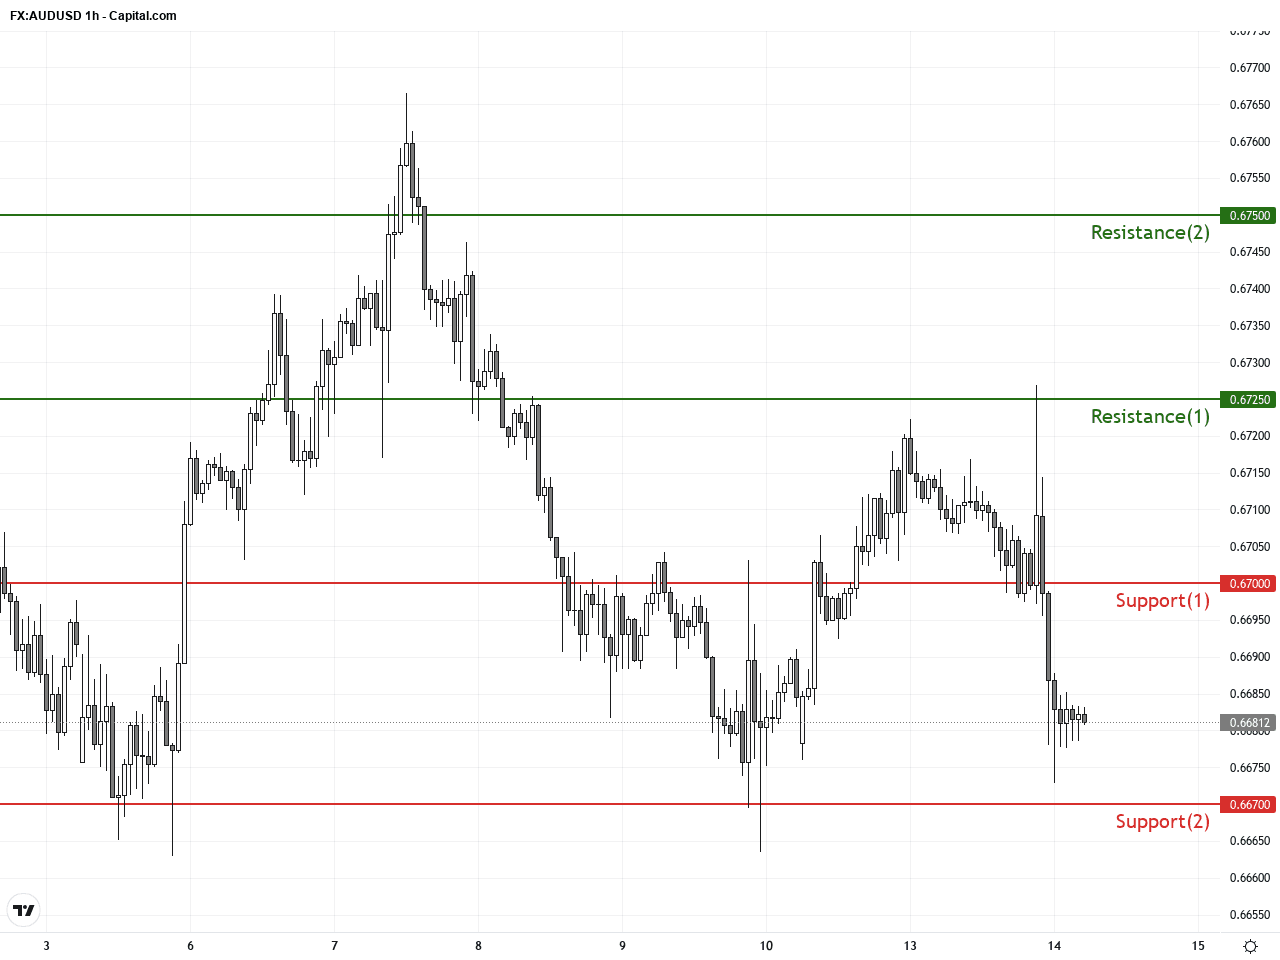
Over the past 24 to 48 hours, the Australian Dollar (AUD/USD) traded narrowly around the 0.67 mark, closing yesterday at 0.6681. Although the pair tested 0.6725 briefly, it eased back to near 0.6700, indicating a lack of decisive momentum in the market.
The main driver behind this price action is investors awaiting key US inflation data, which could influence the Federal Reserve’s monetary policy outlook. Concurrently, concerns over the Fed’s independence have pressured the US dollar, indirectly supporting the Aussie. However, disappointing economic data from China along with a declining Australian trade surplus have weighed on the AUD, limiting its upside.
For the average investor, this means the AUD/USD is currently in a tug-of-war scenario, with bullish factors such as a softer US dollar counterbalanced by regional economic uncertainties. Close attention to upcoming US inflation figures and ongoing developments in China will be critical, as these will play pivotal roles in steering the Aussie’s near-term direction.
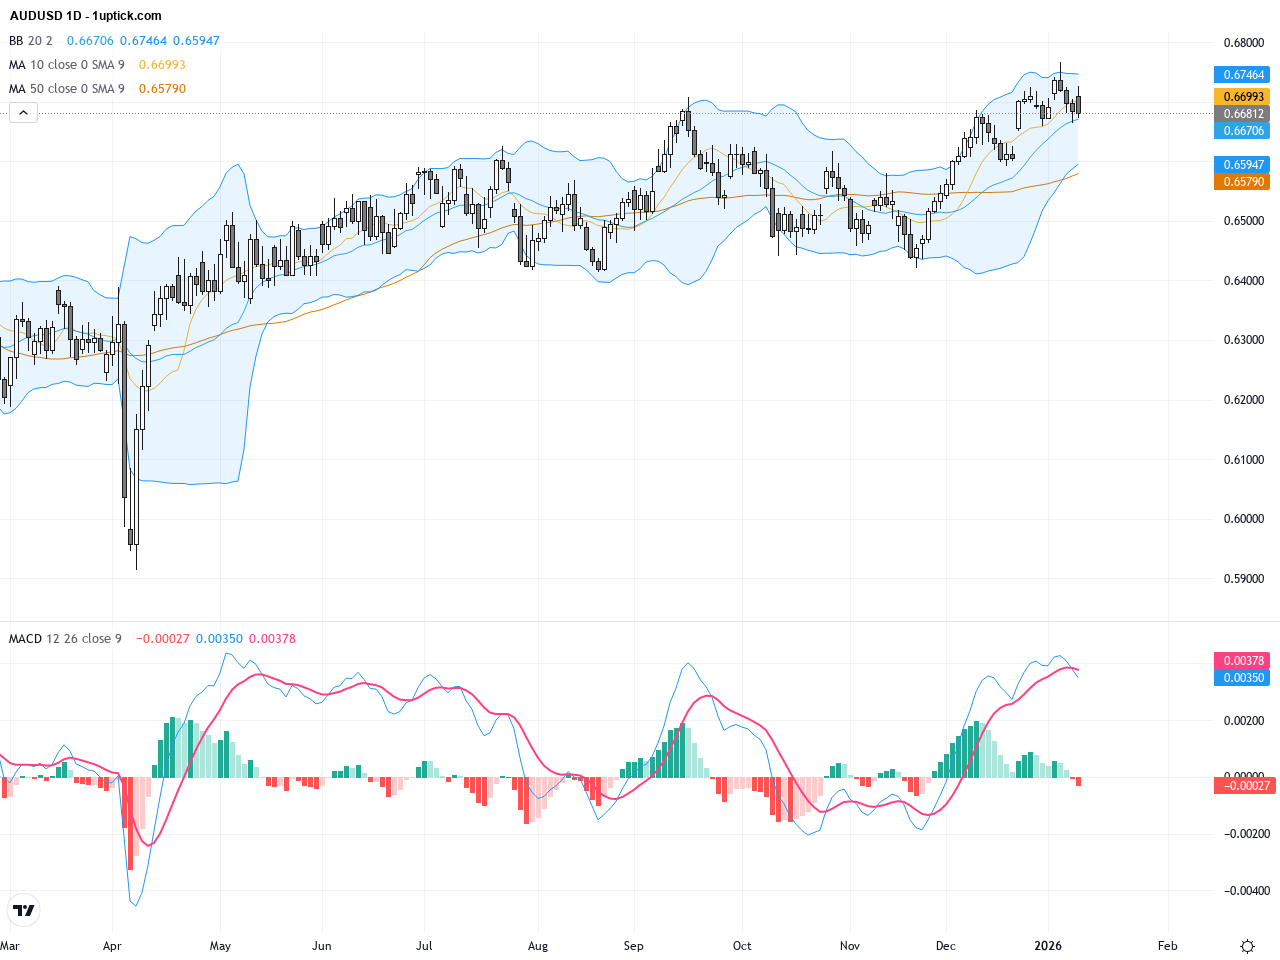
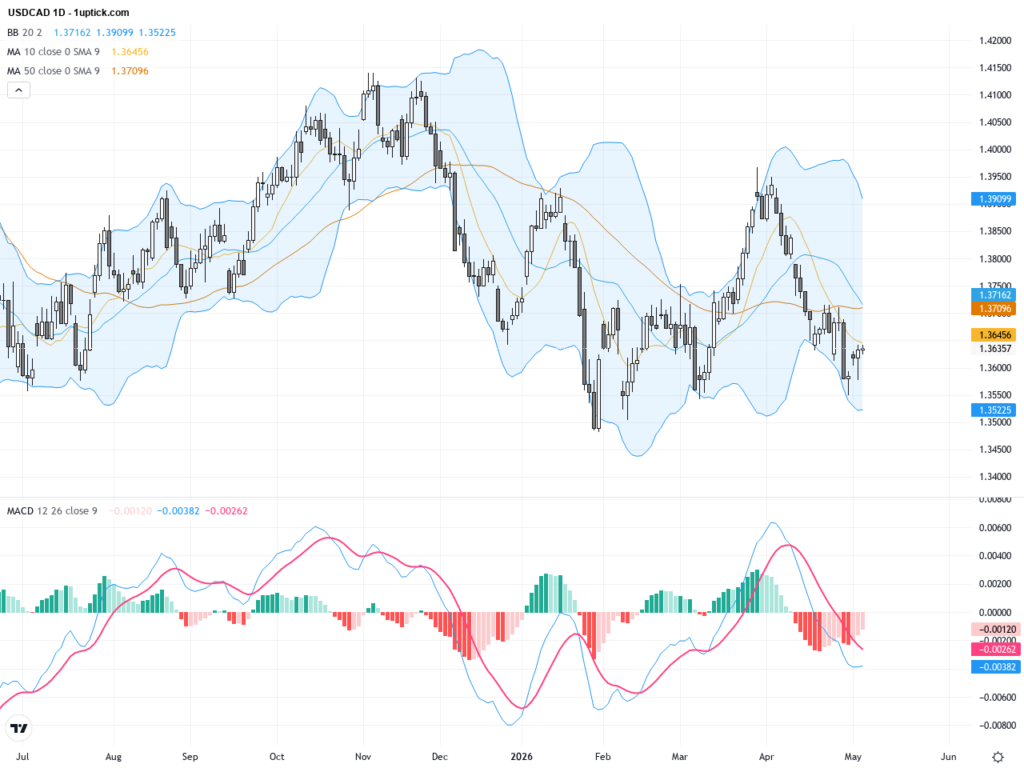
On the daily chart, AUDUSD has maintained a steady ascending channel since the start of the year, facing significant resistance at 0.6725, where multiple failed breakout attempts formed a double top pattern. Volume remains moderate, and both the 50-day (around 0.66179) and 200-day (around 0.65514) moving averages continue to provide support, indicating the medium- to long-term bullish trend persists. However, the closing price’s proximity to the 50-day moving average signals potential short-term retracement. The MACD histogram reflects waning momentum with a potential bearish crossover, and the narrowing Bollinger Bands suggest declining volatility that could precede sideways consolidation.
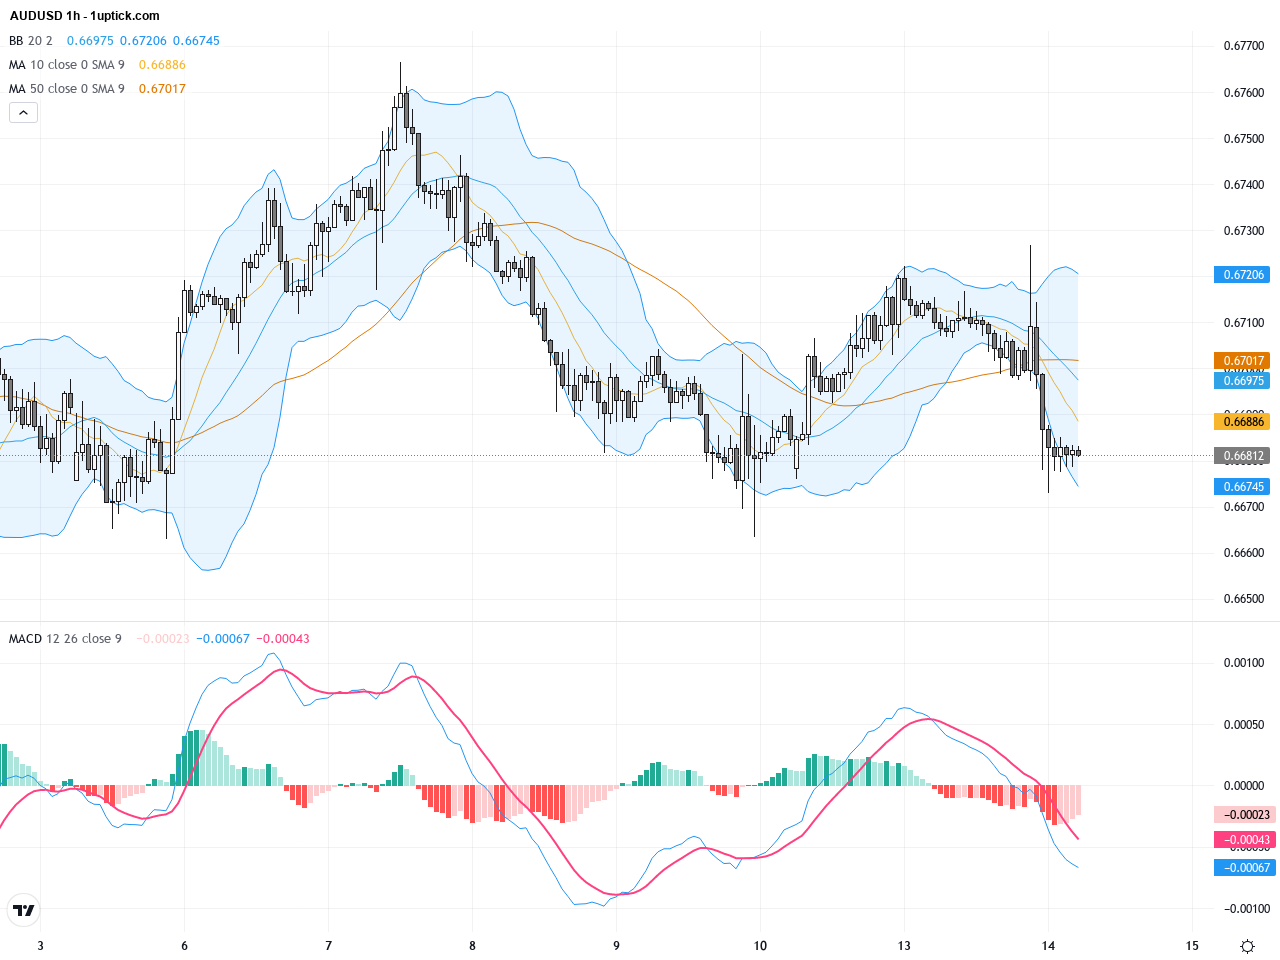
The hourly chart reveals the last 3-5 days’ activity bounded between 0.6700 and 0.6725, crafting a clear symmetric triangle consolidation pattern. The 20-period moving average is flattening, and the RSI hovers near 50, indicating no extreme buying or selling pressure. A recent bearish engulfing candlestick hints at strengthening short-term selling pressure. A break below the 0.6700 support could accelerate declines toward the 0.6670 support level.
Technical Trend: The short-term trend is cautious sideways consolidation.
Technically, AUDUSD is testing a critical support level at 0.6700. Failure to hold this zone could trigger increased selling pressure. The MACD and RSI indicate weakening momentum and potential bearish divergence, warning of a possible correction or consolidation phase. The daily triangle pattern awaits a breakout to determine the next directional move: breaking resistance could reignite the bullish trend toward 0.6750, while breaking support may expose declines toward 0.6670 or lower. Traders should closely watch US inflation data and Fed commentary today as they could catalyze sharp moves, emphasizing the need for strong risk management and agile position adjustments.Today’s GMT+1 economic calendar highlights the US Consumer Price Index (CPI) release at 14:30, a pivotal event for AUDUSD. The CPI data is expected to show steady core inflation at 2.7% year-over-year and 0.3% month-over-month. A stronger-than-expected reading would likely boost the US dollar, placing downward pressure on AUDUSD. Conversely, a softer CPI could weaken the dollar, providing relief for the Australian dollar. Additionally, Australia’s Westpac consumer sentiment data released earlier today may slightly support AUDUSD. Overall, these events could trigger short-term volatility; traders should stay alert around the announcement times.
Resistance & Support
The above financial market data, quotes, charts, statistics, exchange rates, news, research, analysis, buy or sell ratings, financial education, and other information are for reference only. Before making any trades based on this information, you should consult independent professional advice to verify pricing data or obtain more detailed market information. 1uptick.com should not be regarded as soliciting any subscriber or visitor to execute any trade. You are solely responsible for all of your own trading decisions.