


 |
| Gold V.1.3.1 signal Telegram Channel (English) |

USDJPY Holds Firm Above 155.00 as BoJ Signals No Urgent Policy Shift
2026-02-02 @ 11:01
Over the past 24 hours, USD/JPY has held steady above the 155 level, marking its fourth consecutive day of gains. The pair closed at 155.14 yesterday, a significant rise from the previous close of 153.02, indicating strong momentum for the US dollar against the Japanese yen. This strength was primarily driven by signals from the Bank of Japan (BoJ) affirming no immediate urgency to adjust its monetary policy, resulting in a calmer yen and continued inflows into the dollar.
Recent market news points to the BoJ’s cautious stance aligning with earlier hawkish signals, reinforcing a bullish outlook for the dollar among investors. Meanwhile, speculation around potential Fed rate moves has intensified, especially following President Trump’s nomination of Kevin Warsh as the next Fed Chair, further bolstering the dollar. The yen remains under pressure amid this environment as markets digest the BoJ’s steady policy message.
For the average investor, this translates into a landscape where USD/JPY volatility is predominately driven by dollar strength, supported by steady Japanese policy. Currency moves here are not just about forex dynamics but reflect intertwined policy expectations and geopolitical factors. As focus sharpens on the Fed’s new leadership and BoJ’s stance, USD/JPY will continue to offer notable trading opportunities and market interest.
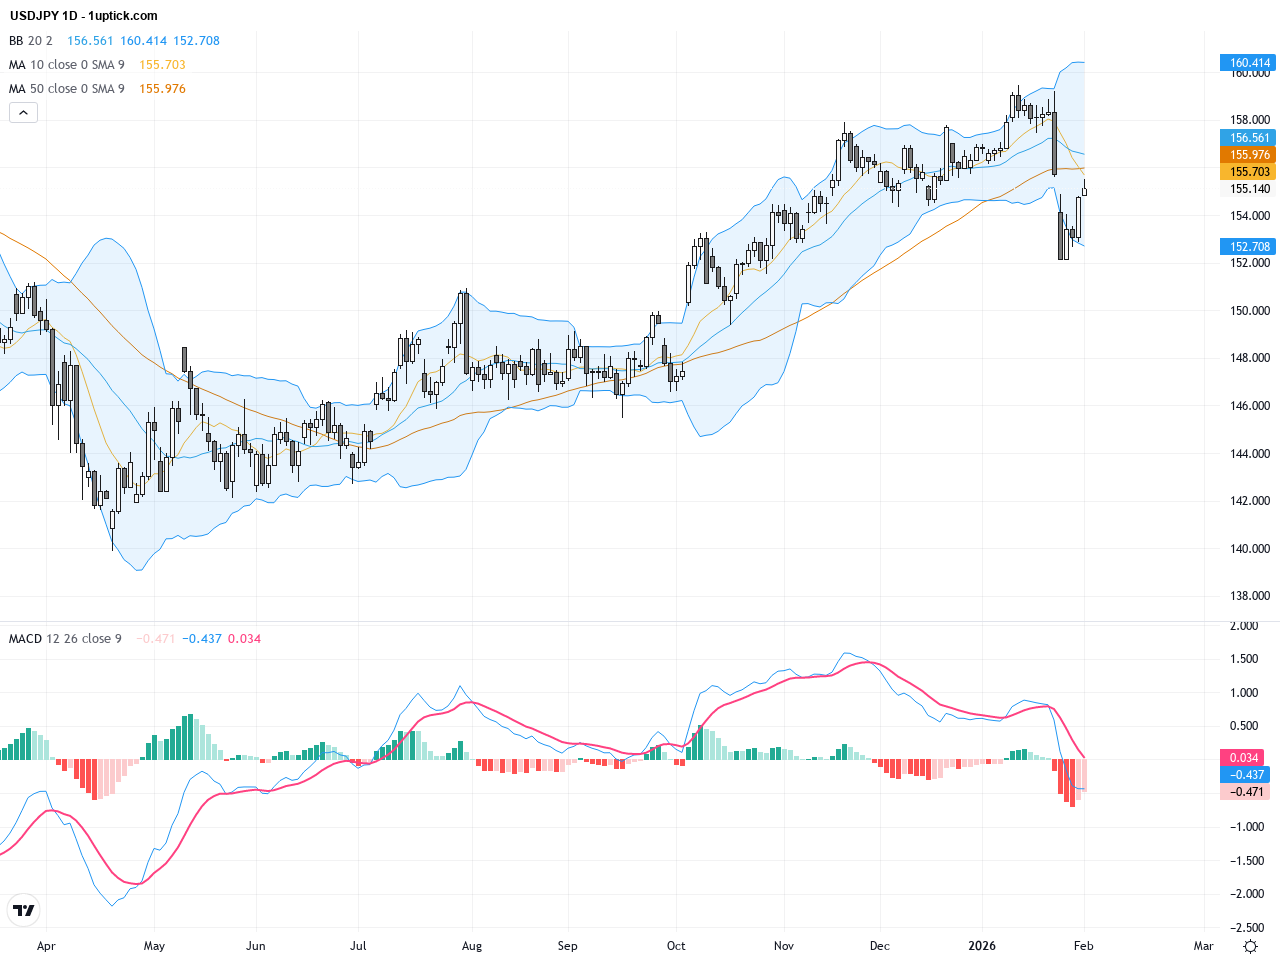
The daily chart reveals a sustained uptrend as USDJPY has broken above recent resistance near 154.80 and is holding above the 155 psychological level. Bollinger Bands are expanding, indicating increased volatility, with prices predominantly trading between the middle and upper bands. The MACD indicator shows the fast line firmly above the slow line, confirming strong bullish momentum. The 50-day moving average remains above the 200-day average, reinforcing a bullish trend in the medium to long term. Overall, the daily chart presents a clear bullish bias for USDJPY.

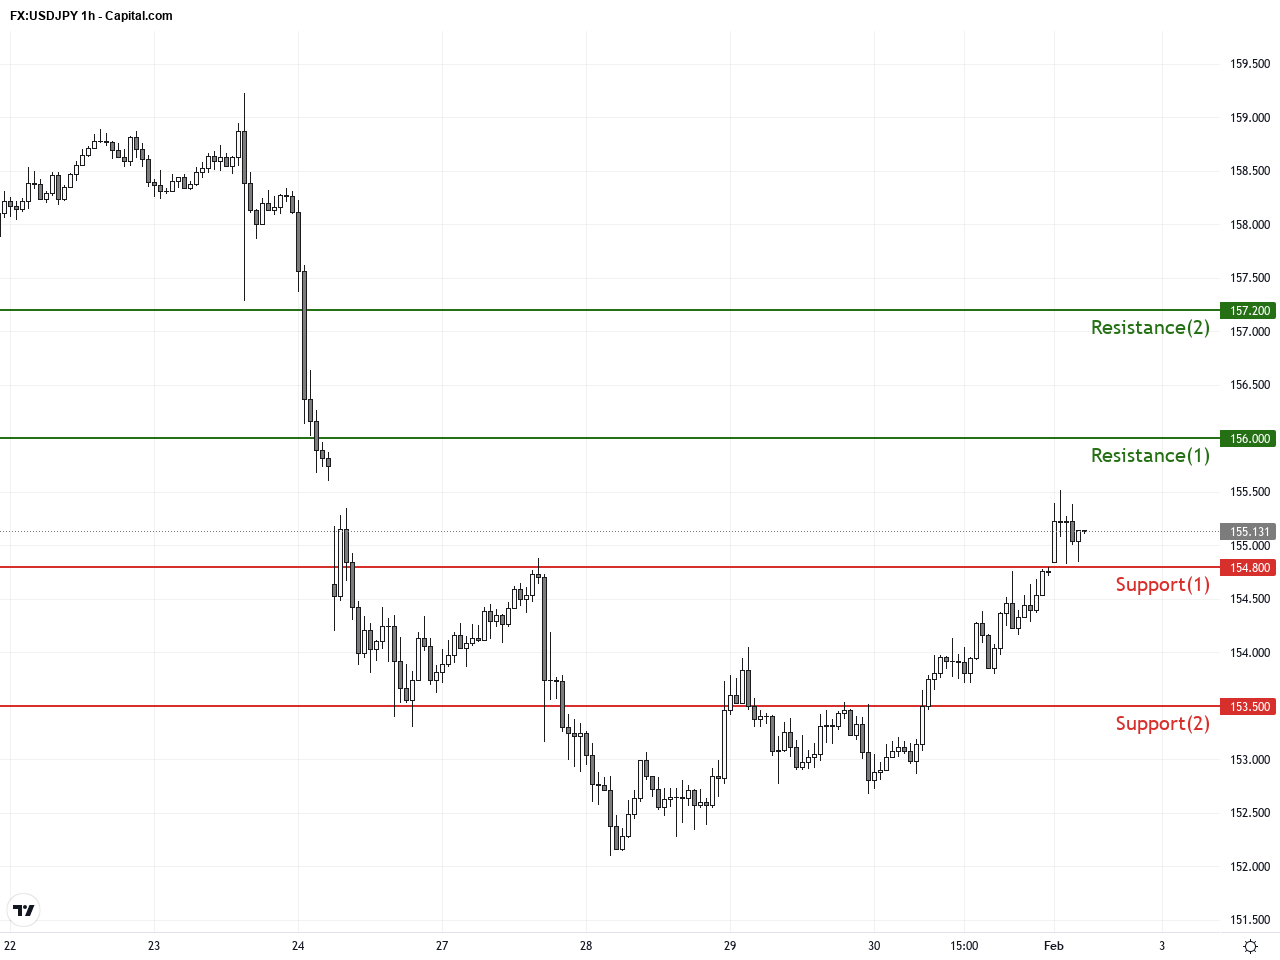
On the hourly chart over the past 3-5 days, USDJPY shows a steady ascending consolidation. Prices oscillate around the 20-period simple moving average (SMA), frequently rebounding from the Bollinger Bands’ middle band. A bullish MACD cross above the zero line signals strong short-term buying interest. A small flag pattern has formed recently, suggesting a breakout with upward continuation potential. Recent candlesticks include a hanging man pattern, indicating potential short-term volatility and requiring focus on key technical support and resistance zones.
Technical Trend: Current Trend: Decisively Bullish
Technically, USDJPY remains strongly bullish with a daily MACD golden cross and positive EMA alignment confirming upward momentum. Hourly chart flag formation and hanging man candlestick signal short-term volatility, possibly leading to a breakout or pullback. Traders should watch for volume and MACD histogram changes to gauge the strength of the next move.Today’s economic calendar in GMT+1 highlights the final manufacturing PMI for Japan in January, unchanged at 51.5, reflecting ongoing manufacturing expansion and marginal support for the yen. Other global manufacturing PMIs will be released but are less directly relevant to USDJPY. Overall, no significant economic event scheduled today is expected to cause a direct, immediate impact on USDJPY, with market attention remaining on BoJ policy signals and U.S. data developments.
Resistance & Support
The above financial market data, quotes, charts, statistics, exchange rates, news, research, analysis, buy or sell ratings, financial education, and other information are for reference only. Before making any trades based on this information, you should consult independent professional advice to verify pricing data or obtain more detailed market information. 1uptick.com should not be regarded as soliciting any subscriber or visitor to execute any trade. You are solely responsible for all of your own trading decisions.