


 |
| Gold V.1.3.1 signal Telegram Channel (English) |
USDJPY Technical & Fundamental Analysis: Key Breakout Near 159.50 and Intraday Support Levels
2026-03-23 @ 11:02
Over the past 24 to 48 hours, the USD/JPY pair continued its strong momentum, climbing from yesterday’s closing price of 159.521 to highs around 159.58, indicating sustained demand for the US dollar. Throughout the Asian session, USD/JPY maintained elevated levels, even breaking above the key 159.50 mark, signaling clear market preference for the greenback over the yen.
The core driver behind this dollar strength is the escalating geopolitical tensions in the Middle East, particularly concerns over a prolonged US-Iran conflict, which have increased safe-haven demand and pushed the Dollar Index higher by over 0.4% on Friday. Under the dual pressure of geopolitical instability and oil price fluctuations, the dollar has solidified its role as a safe-haven currency, while the yen, traditionally seen as a safe currency, is relatively constrained due to the Bank of Japan’s continued dovish stance and the looming risk of forex intervention, allowing USD/JPY to move upward.
For the average investor, this environment can be viewed as a scenario where the US dollar attracts capital flows amid multiple uncertainties thanks to its safe-haven appeal, while the yen is sidelined due to domestic policy and international pressures. This recent move is a reminder that when geopolitical risks intensify, demand for the dollar and US assets rises, pushing USD/JPY higher and increasing risks for those holding yen-based assets.

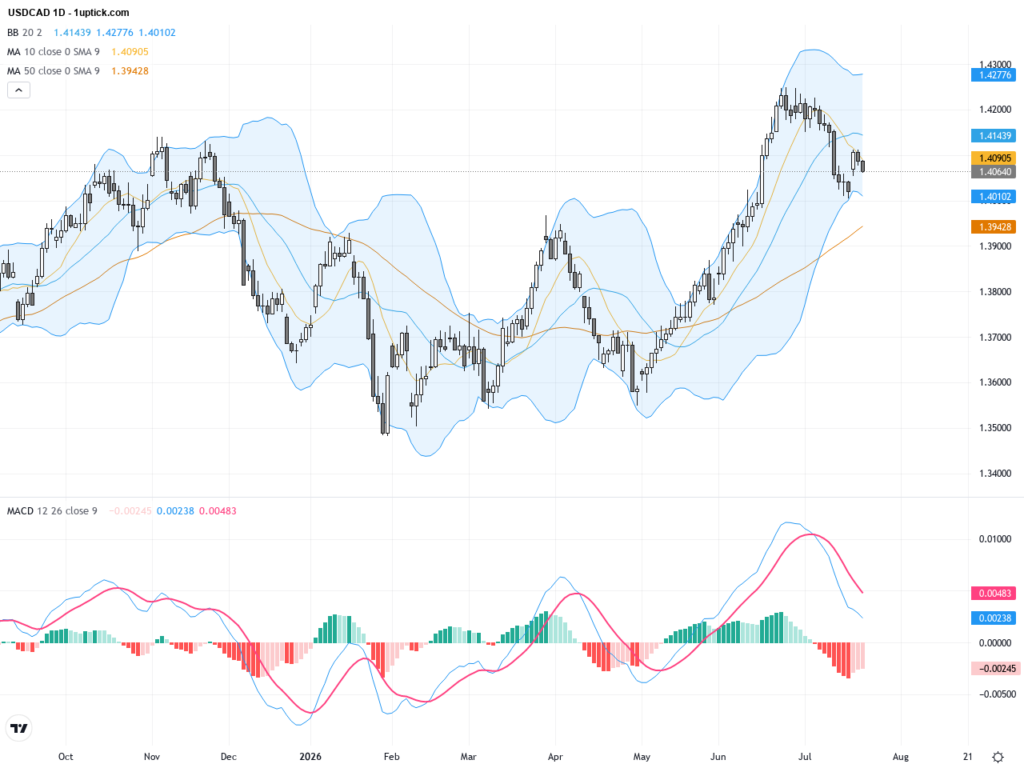
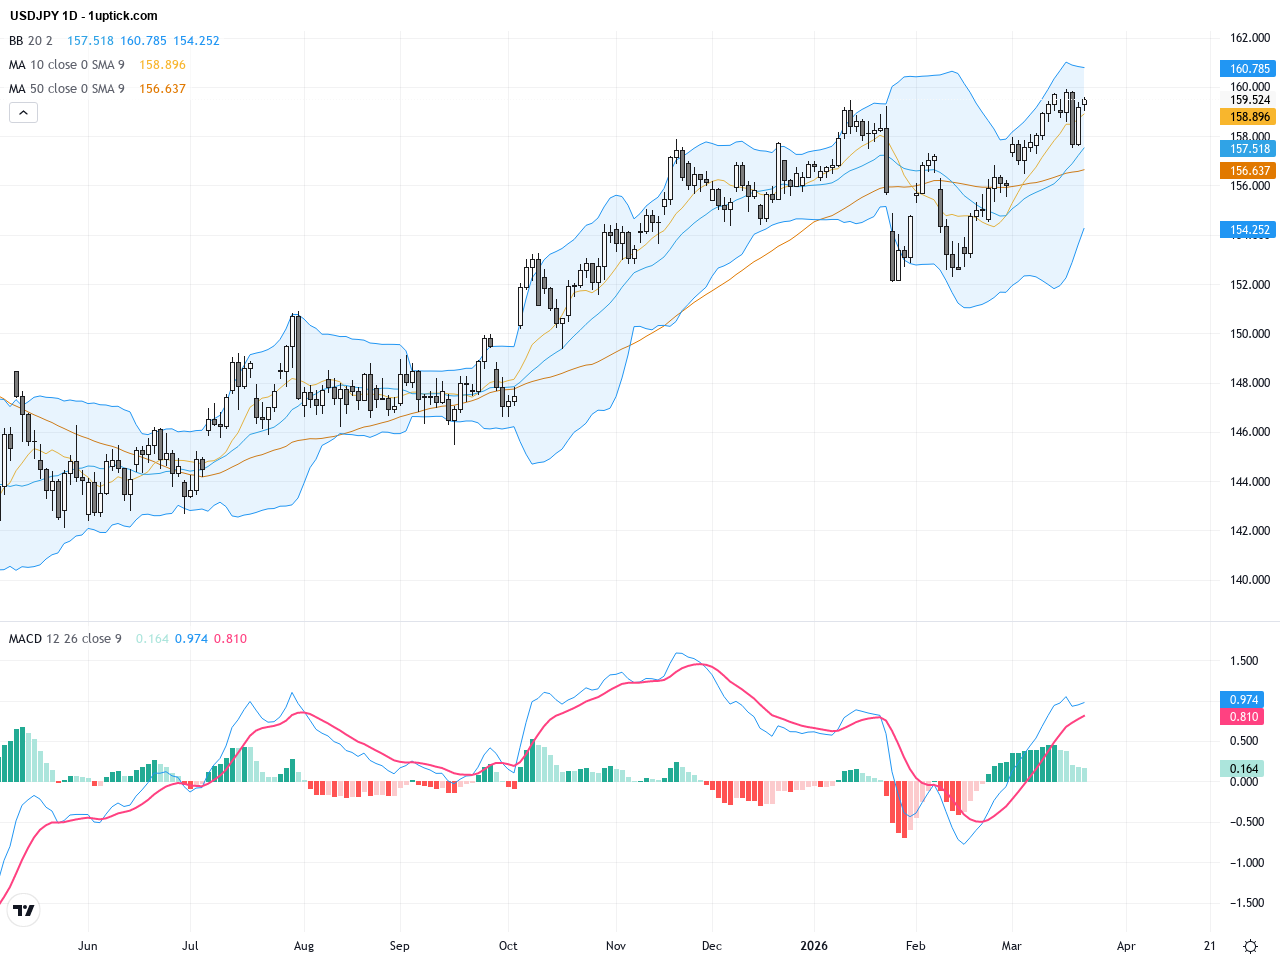
The daily chart depicts a clear uptrend in USDJPY, with prices consistently trading above the 50-day and 200-day moving averages, signaling strong bullish momentum. Bollinger Bands are widening, indicating increased volatility. The MACD remains above zero with the signal line supporting further upside. Since the beginning of the month, buyers have dominated, as each retracement finds support, reflecting sustained preference for the US dollar against the yen.
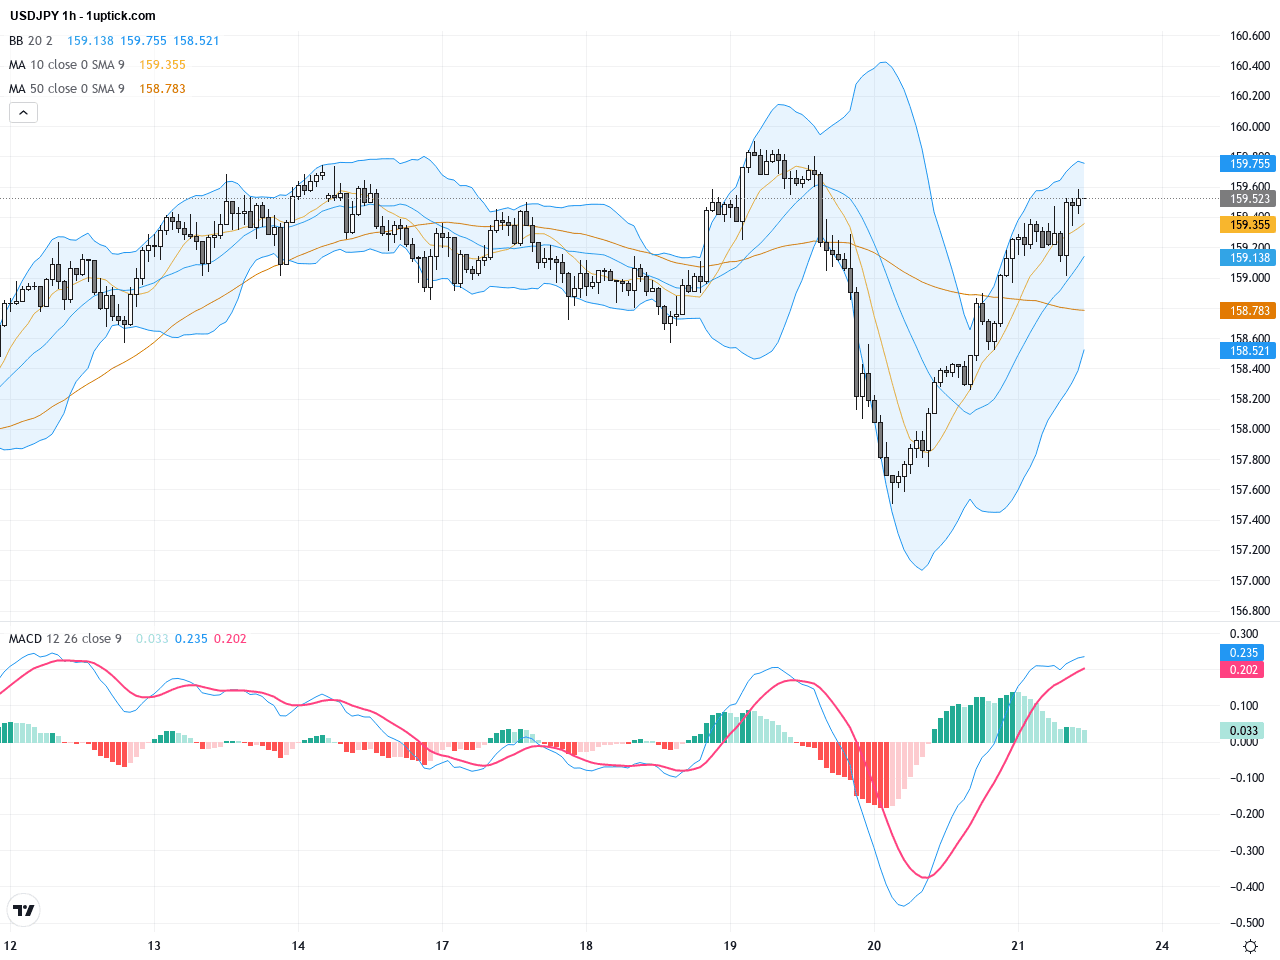
On the hourly chart, USDJPY shows short-term consolidation in a range between 159.0 and 159.7 over the past few days. The 20-period moving average lies near the midpoint of this range, showing reduced short-term momentum. A recent bullish engulfing candlestick pattern suggests potential upside within the next 24 hours. MACD momentum is approaching a bullish crossover, supporting short-term strength. Price sits near the Bollinger Bands’ middle band, awaiting a catalyst for directional movement, making it crucial for traders to monitor breakout or pullback signals.
Technical Trend: Sustained strong uptrend
Technically, the expanded Bollinger Bands and sustained MACD bullishness on the daily chart affirm strength in the medium to long term. The hourly chart’s bullish engulfing candle and near-MACD golden cross indicate possible short-term momentum continuation. Traders should watch the 159.50–160 resistance zone closely, as it is prone to profit-taking and potential intervention fears. Monitoring volume and breakout validation remains key for identifying high-probability trade entries.Today’s economic events include Poland’s February retail sales data at 09:30 GMT+1, forecasted to show year-over-year growth of 5.4%, improving from the previous 3.9%. Money Supply M3 data for Poland at 14:00 is expected steady at 10%. The US January construction spending report at 15:00 is forecasted slightly lower at 0.1% month-over-month. Overall, no significant or direct events are scheduled that will materially impact USDJPY today. Short-term price action will likely follow geopolitical news and broader market sentiment.
Resistance & Support

The above financial market data, quotes, charts, statistics, exchange rates, news, research, analysis, buy or sell ratings, financial education, and other information are for reference only. Before making any trades based on this information, you should consult independent professional advice to verify pricing data or obtain more detailed market information. 1uptick.com should not be regarded as soliciting any subscriber or visitor to execute any trade. You are solely responsible for all of your own trading decisions.