 |
| Gold V.1.3.1 signal Telegram Channel (English) |
GBPUSD Technical Breakout: Key Support and Resistance Levels to Watch
2026-03-23 @ 13:03
Over the past 24 to 48 hours, GBP/USD has shown noticeable volatility but overall edged slightly lower. Yesterday’s closing price settled at 1.3323, marking a modest decline from the previous day as market participants adopted a cautious stance amid various economic and political factors.
One of the key drivers behind recent GBP/USD movements is the structural weakness in the US dollar. Despite a short-lived rally in the Dollar Index (DXY) triggered by geopolitical tensions in the Middle East, the rebound was underwhelming and the dollar failed to sustain strength, providing some support to the pound. However, as geopolitical risks eased, safe-haven demand for the dollar diminished, causing turbulence in the cable pair.
Meanwhile, investors broadly expect the Federal Reserve (Fed) and the Bank of England (BoE) to hold interest rates steady in upcoming decisions. This expectation applied downward pressure on the pound as some market participants moved to safer assets in the absence of a rate hike signal. Furthermore, UK inflation data revealed ongoing food price pressures, keeping the economic outlook uncertain and weighing further on the pound.
For the average investor, this means that while the pound has enjoyed short-term relief from dollar weakness, overall market sentiment remains cautious and hesitant. The uncertainty around monetary policy and inflation risks has intensified currency volatility. Investors are advised to closely monitor the forthcoming central bank meetings and macroeconomic releases, as these will be pivotal in shaping GBP/USD movements in the near term.

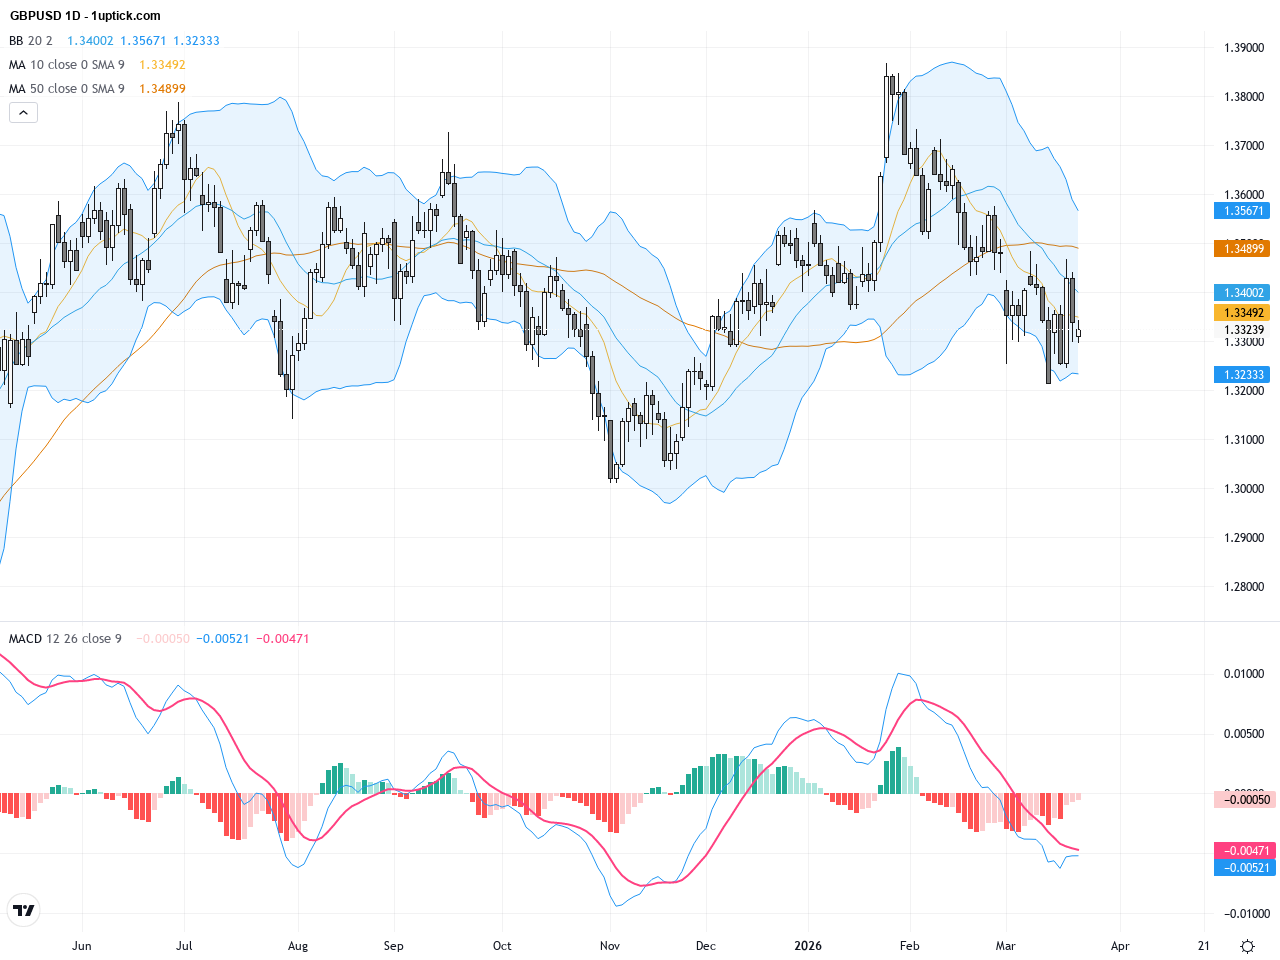
The daily chart reflects a prolonged downtrend for GBPUSD since the start of the year, recently marked by a decisive break below a vital ascending trendline. The 20- and 50-day moving averages are exerting downward pressure, with multiple failed attempts to break higher. The MACD indicator is deep in negative territory with expanding divergence, signaling bearish momentum. Bollinger Bands are narrowing, suggesting reduced volatility but caution for a possible bearish breakout continuation.

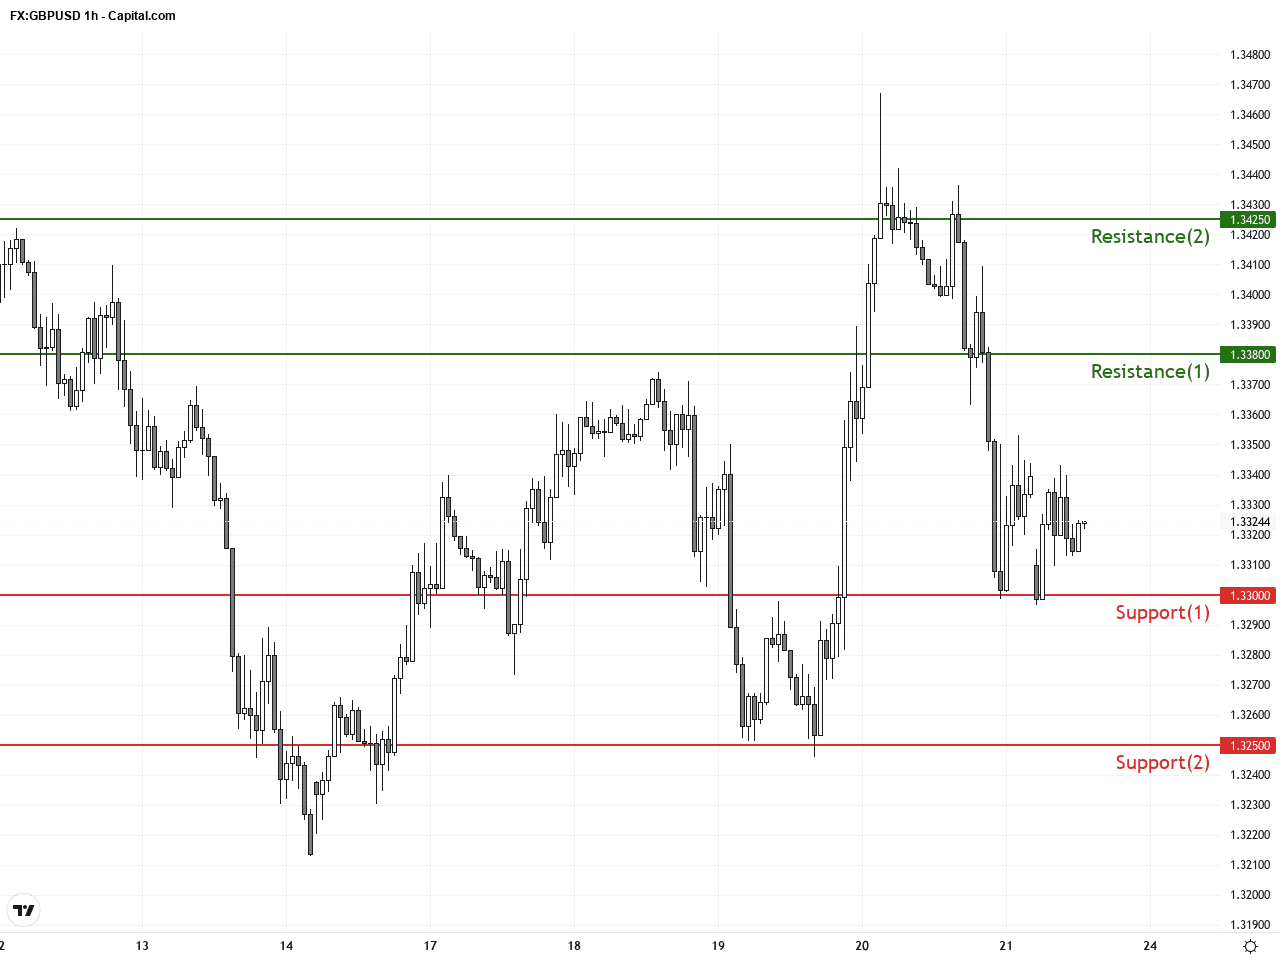
In the last 3-5 days visible on the hourly chart, GBPUSD displays repeated oscillations with rebounds near the 1.3300 support level but unable to sustain moves above 1.3350. Short-term moving averages show a bearish crossover, and the MACD histogram is negative but shrinking, indicating diminishing selling pressure. Recent candlesticks include small hammer shapes, hinting at a short-term bounce attempt while the overall trend remains bearish.
Technical Trend: Cautiously Bearish Trend
Technical analysis points to a cautious bearish phase for GBPUSD with a key trendline break confirming near-term weakness. MACD and moving average crossovers support downside momentum, although hourly chart hammer candlestick patterns and MACD contraction suggest possible short-term corrective rebounds. Investors should watch if the 1.3300 support level holds—breach could confirm the continuation of the downtrend. This week’s economic data will be crucial for next directional cues—risk management strategies are essential.Today’s economic calendar highlights Polish retail sales data at 09:30 GMT+1, expected to improve year-over-year, though with limited direct effect on GBPUSD. Later at 15:00, US construction spending data release may influence the dollar; stronger figures could support USD, pressuring GBPUSD lower, and vice versa for weaker data. No major UK or Federal Reserve events are scheduled today, implying limited immediate impact on GBPUSD.
Resistance & Support
The above financial market data, quotes, charts, statistics, exchange rates, news, research, analysis, buy or sell ratings, financial education, and other information are for reference only. Before making any trades based on this information, you should consult independent professional advice to verify pricing data or obtain more detailed market information. 1uptick.com should not be regarded as soliciting any subscriber or visitor to execute any trade. You are solely responsible for all of your own trading decisions.