


 |
| Gold V.1.3.1 signal Telegram Channel (English) |

WTI Crude Oil: Middle East Tensions Spark Supply Risk and Bullish Flag Pattern
2026-03-05 @ 06:03
In the past 24 to 48 hours, WTI crude oil markets experienced notable volatility, with prices fluctuating around yesterday’s closing price of $75.94. The escalation of the US-Iran conflict heightened global energy supply risks, particularly with the shutdown of tanker traffic through the Strait of Hormuz, sharply increasing uncertainties in oil pricing.
Recent reports indicate that regional attacks threaten vital production facilities in Qatar, Saudi Arabia, and Iraq, exposing broader infrastructure vulnerabilities across the Middle East energy sector. This scenario has caused international crude benchmarks like Brent to surge more sharply compared to US WTI crude, which has sought equilibrium amid the turmoil. US government assurances to insure tankers and provide naval escorts have partially eased panic in the market.
For the average investor, these developments illustrate a period rich in uncertainty but also opportunity. Geopolitical tensions suggest oil prices may remain elevated and volatile in the near term, prompting investors to reassess risk and reward profiles within energy markets. Moving forward, oil price trends will increasingly hinge on supply fundamentals and global demand dynamics as the market absorbs these evolving risks.
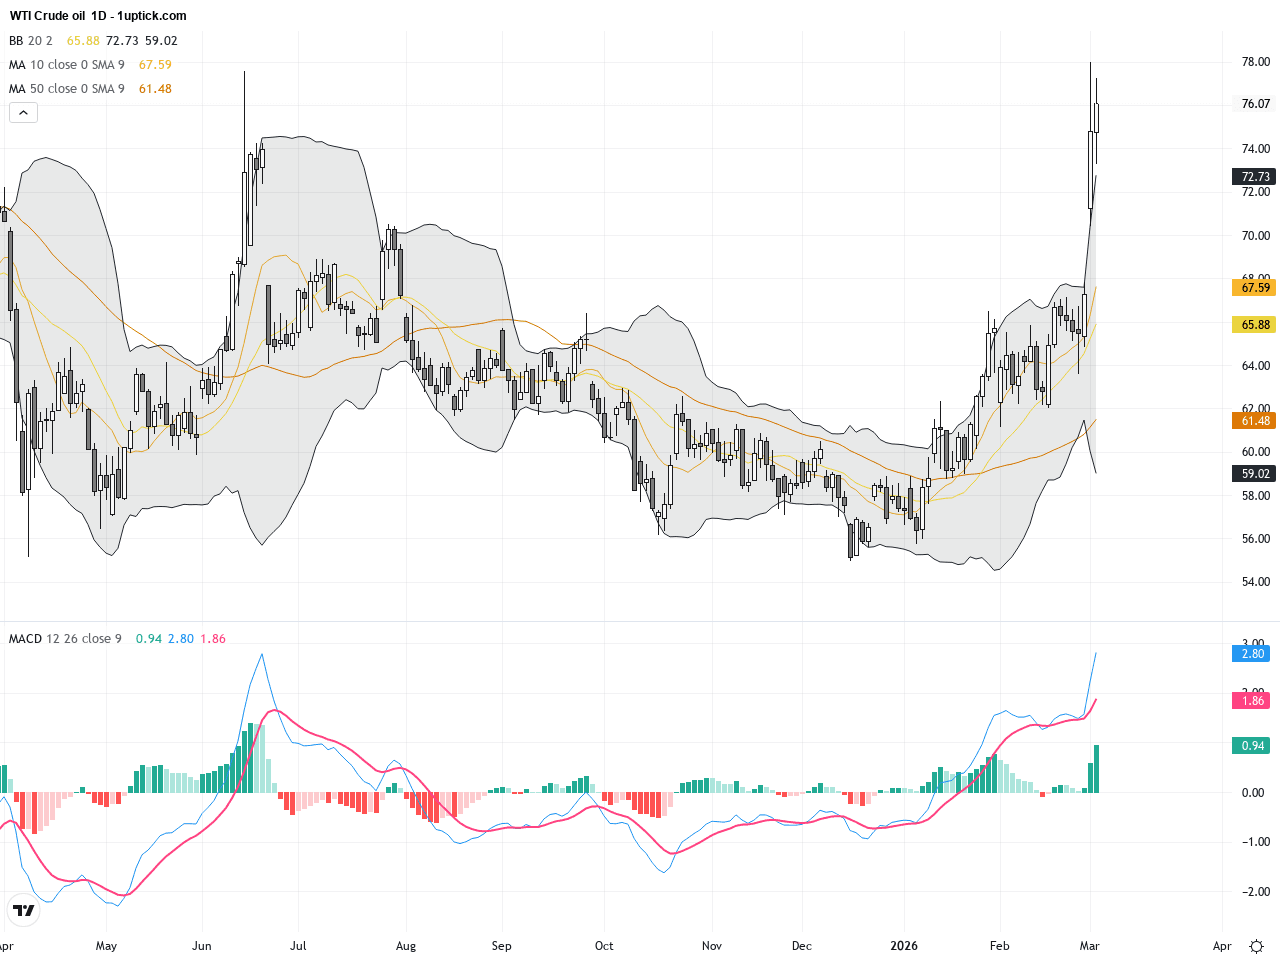
The daily chart of WTI indicates a clear uptrend since early February, with prices steadily climbing from the low $60s to above $75. The 20-day moving average has turned upwards, with prices frequently approaching and surpassing the upper Bollinger Band, suggesting strong momentum. The MACD remains positive with widening bullish divergence, confirming continued buying interest. Notably, a bullish flag pattern has formed recently, often signaling a strong continuation move after a consolidation phase. A decisive break above the recent high of $75.94 would confirm this bullish setup and could lead to further gains.
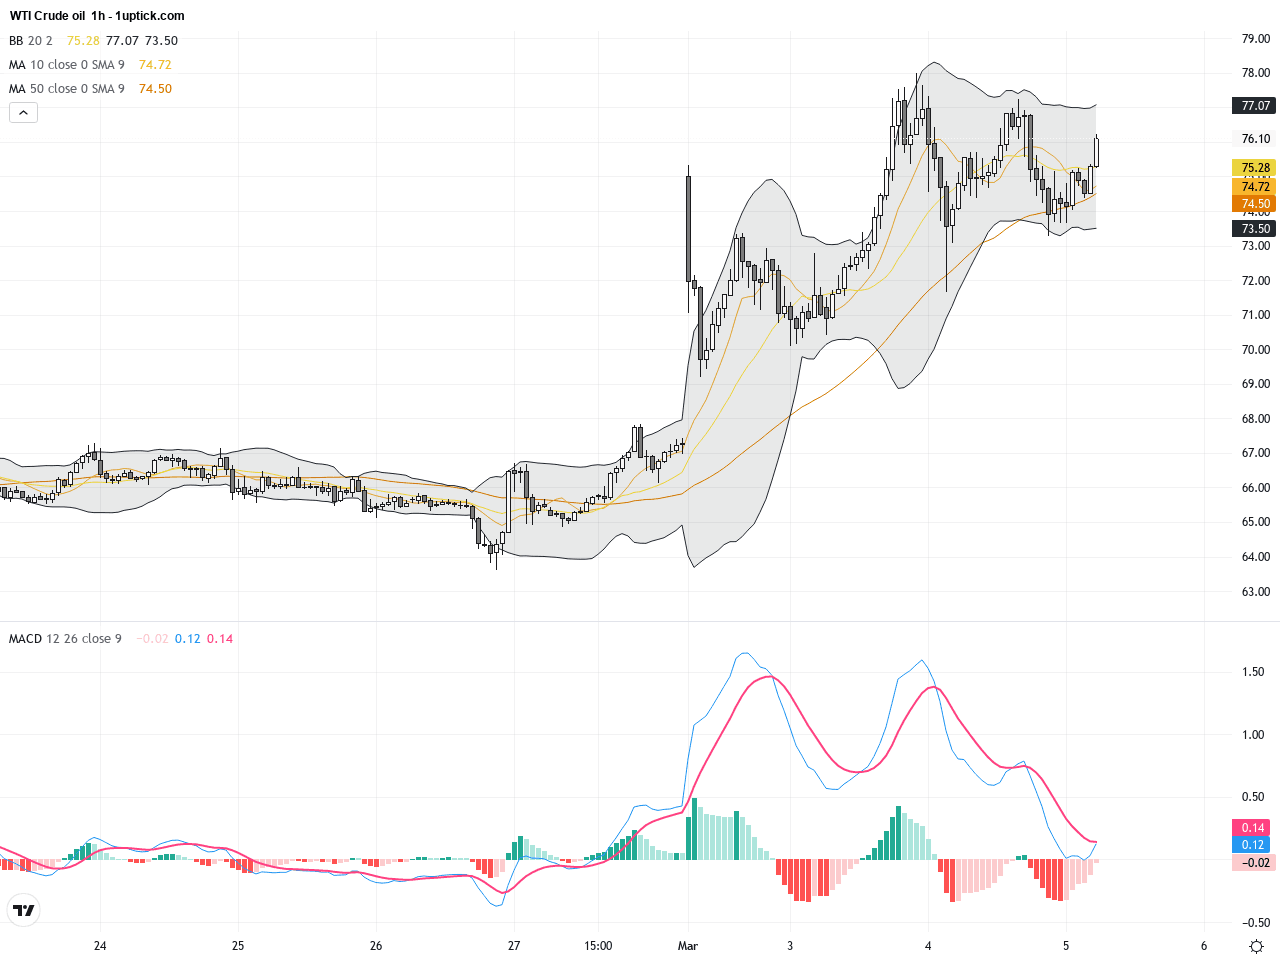
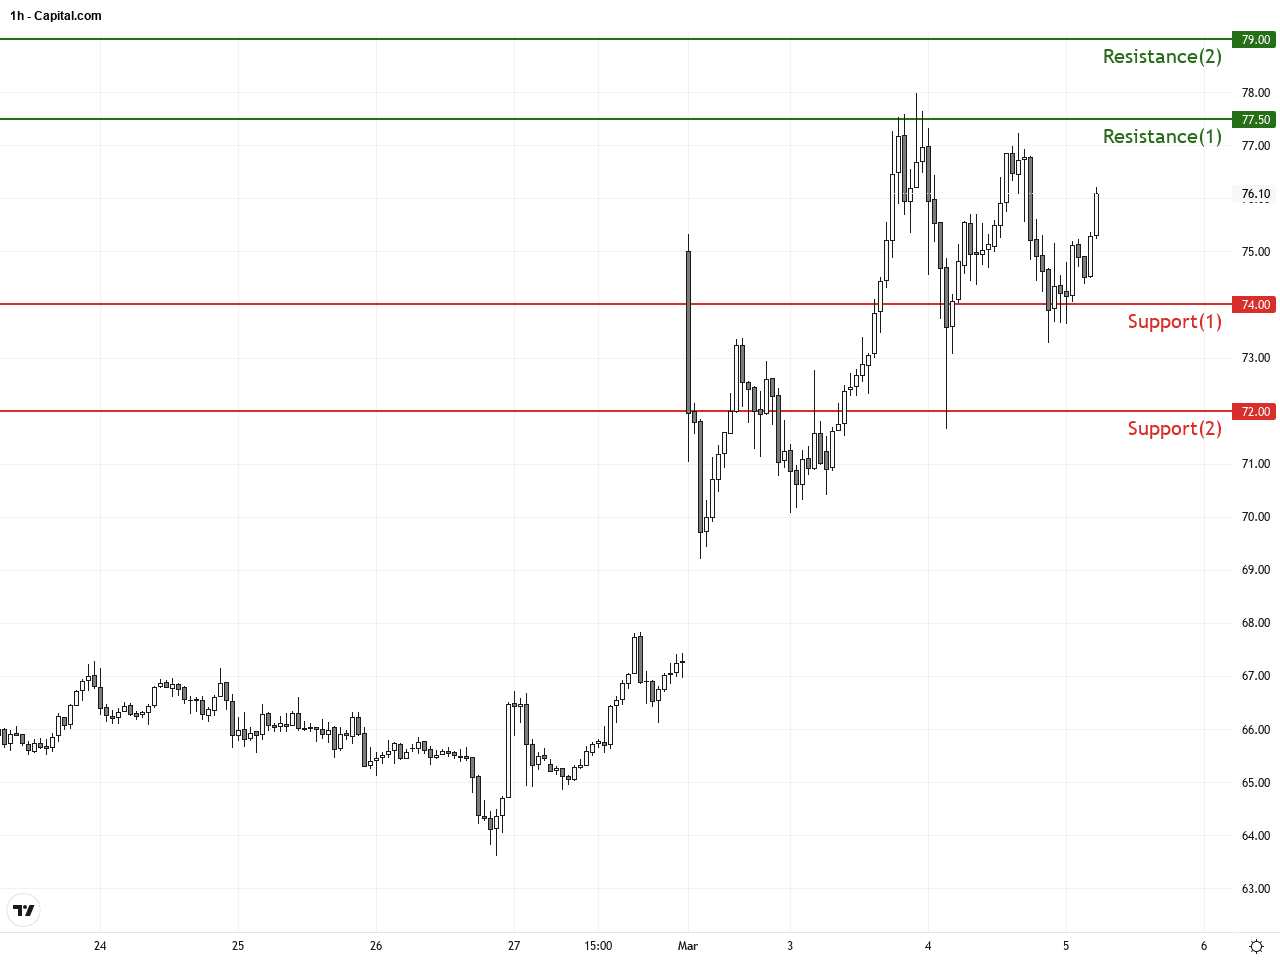
On the hourly chart over the past 3-5 days, WTI has been consolidating between $75 and $77, reflecting market sensitivity to ongoing supply concerns in the Middle East. The 50- and 200-hour moving averages maintain a bullish alignment, though near-term price action shows minor resistance. Bollinger Bands are tightening, indicating reduced volatility and the potential for an imminent breakout. The MACD shows mixed momentum signals with occasional crossovers near the zero line, hinting at uncertain short-term direction. A recent engulfing candlestick pattern signals a possible short-term reversal or pullback to watch closely.
Technical Trend: The current trend for WTI Crude Oil is decisively bullish with a short-term cautious sideways consolidation, positioning for a potential breakout higher.
The technical highlight remains the strong bullish momentum on the daily MACD and the clear formation of a bullish flag pattern, suggesting a high-probability continuation of the recent uptrend. However, the appearance of an engulfing candlestick on the hourly chart warns of a potential short-term retracement. The narrowing Bollinger Bands further hint at an impending decisive price move. A break above $75.94 resistance would confirm bullish strength, supported by solid trading volumes.There are no significant or directly relevant economic events on today’s calendar that are expected to impact WTI Crude Oil prices. Geopolitical factors remain the primary influence, so traders should focus on news flow and technical triggers for near-term trade decisions.
Resistance & Support
The above financial market data, quotes, charts, statistics, exchange rates, news, research, analysis, buy or sell ratings, financial education, and other information are for reference only. Before making any trades based on this information, you should consult independent professional advice to verify pricing data or obtain more detailed market information. 1uptick.com should not be regarded as soliciting any subscriber or visitor to execute any trade. You are solely responsible for all of your own trading decisions.