


 |
| Gold V.1.3.1 signal Telegram Channel (English) |
USDJPY: Technical Patterns and Rate Hike Expectations Drive Dollar-Yen Volatility
2026-04-06 @ 11:01
Over the past 24 to 48 hours, the USD/JPY exchange rate fluctuated between 159.5 and 160.2, closing yesterday at 159.548, slightly down from the prior close of 159.632. Market sentiment has been influenced by geopolitical tensions and expectations of a potential Bank of Japan (BoJ) rate hike, causing notable volatility.
As U.S. President Trump’s remarks regarding the Middle East conflict added uncertainty, the U.S. dollar continued to strengthen, with the dollar index nearing its highest level this month. This bolstered USD/JPY, especially in the context of geopolitical tensions driving oil prices above $115 per barrel, which enhanced safe-haven demand for the dollar.
Additionally, markets widely anticipate another BoJ rate increase this month, which could support the yen. However, verbal intervention warnings from Tokyo have put some pressure on USD/JPY, limiting its short-term upside. Put simply, investors remain cautious amid potential policy shifts and geopolitical instability.
For the average investor, these developments underline the current global economic volatility. Those holding dollar assets may benefit from heightened safe-haven demand in the near term, while those focused on the yen should watch for possible market interventions and the impact of changes in Japan’s monetary policy.

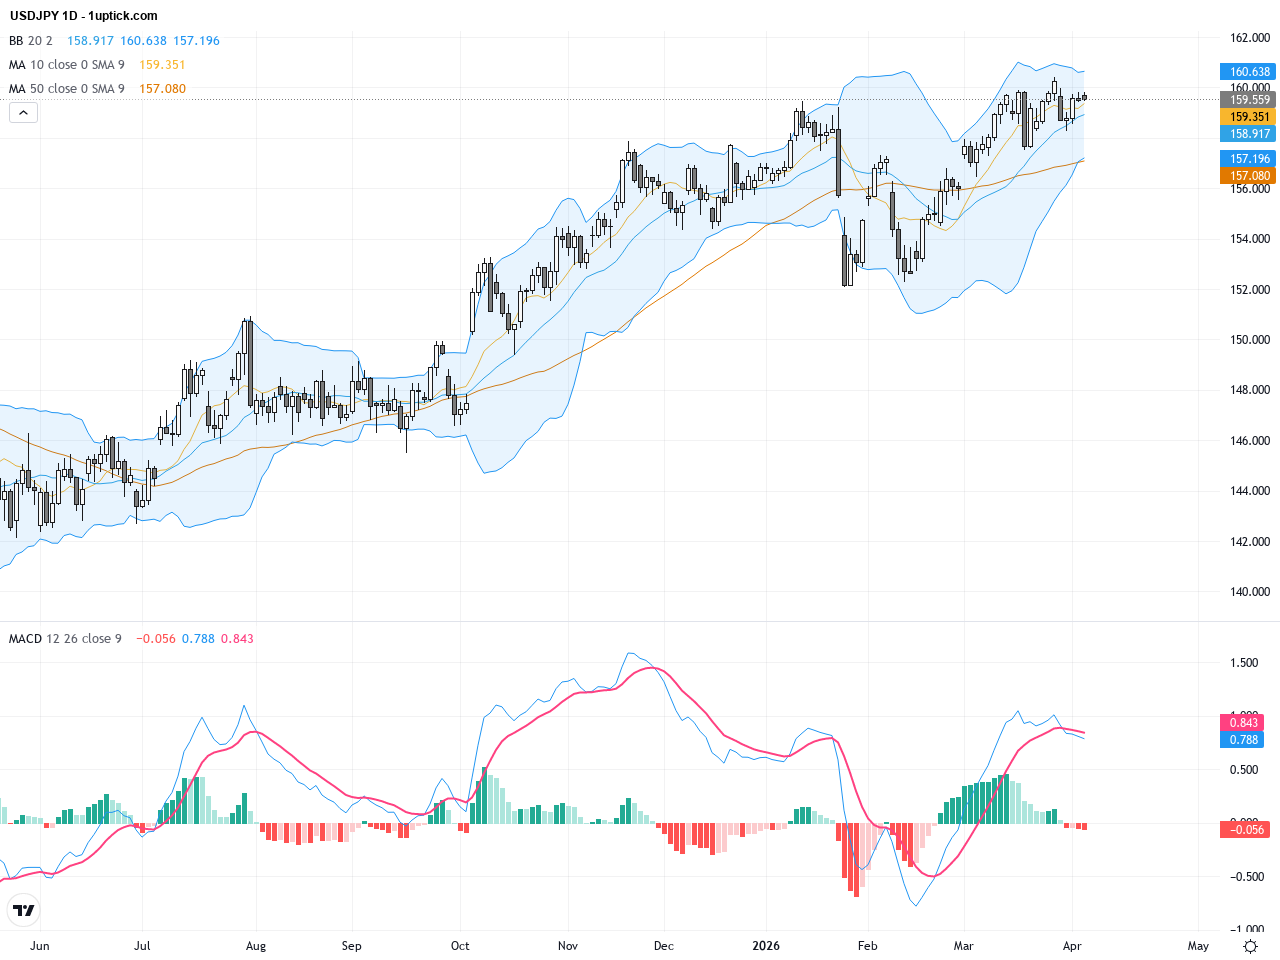
The daily chart reveals a clear upward trend in USDJPY, with prices consistently trading above both the 50-day (156.7) and 200-day (152.7) moving averages, indicating solid bullish momentum. Bollinger Bands are slightly widening with prices near the middle band, hinting at a favorable scenario for further upside moves. The MACD remains above zero with expanding bullish histogram bars, reinforcing positive momentum. Overall, the daily view confirms a steady uptrend but signals resistance near the 160.2 yearly high.
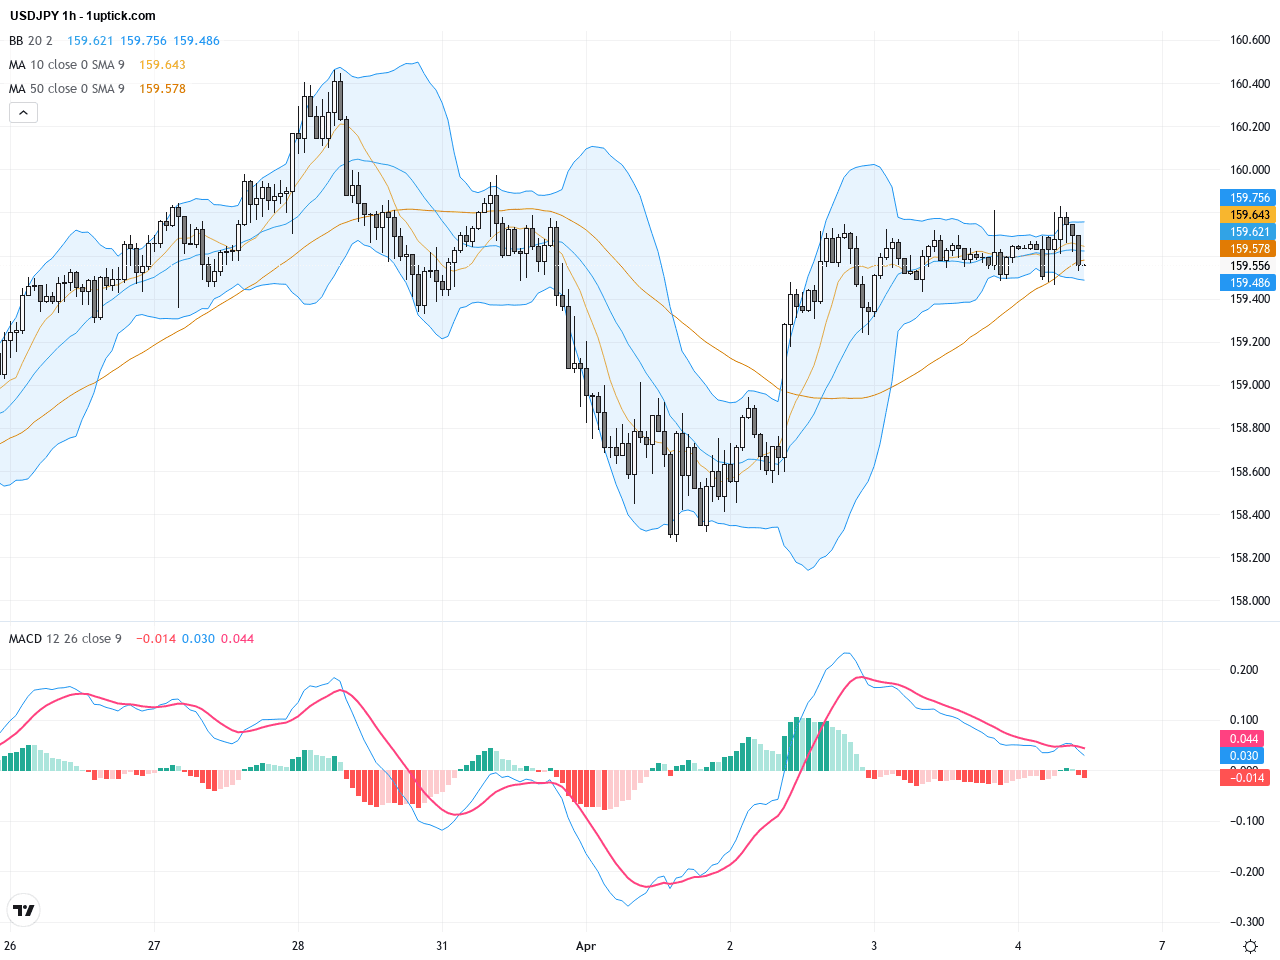
The hourly chart over the past 4-5 days shows increased volatility, with USDJPY briefly breaking above 160 but failing to hold gains, retreating back towards 159.5. A golden cross of short- and medium-term moving averages suggests bullish bias, though MACD lines remain close, reflecting uncertainty in short-term momentum. The expanding Bollinger Band width indicates heightened price swings ahead. Key intraday levels to watch are support at 159.4 and resistance at 160.2 for clues on the next directional move.
Technical Trend: Trend Assessment: Cautiously Bullish.
Technical analysis highlights that USDJPY maintains bullish momentum over both daily and hourly charts, with potential to break the 160 psychological barrier. However, intervention risk remains a latent factor. The MACD shows early signs of strengthening momentum, suggesting a probable short-term rally. Traders should plan entries carefully with well-defined support and resistance zones to manage risk effectively.At 16:00 GMT+1, the US will release the key ISM Non-Manufacturing Index along with related sub-indexes. The consensus forecast is 55, down from 56.1 previously. A reading exceeding forecasts would boost the US dollar, likely pushing USDJPY higher. Conversely, a miss could weigh on the dollar and soften the pair. Given ongoing expectations of a BOJ rate hike this month, these data releases are poised to heavily influence USDJPY’s near-term price action.
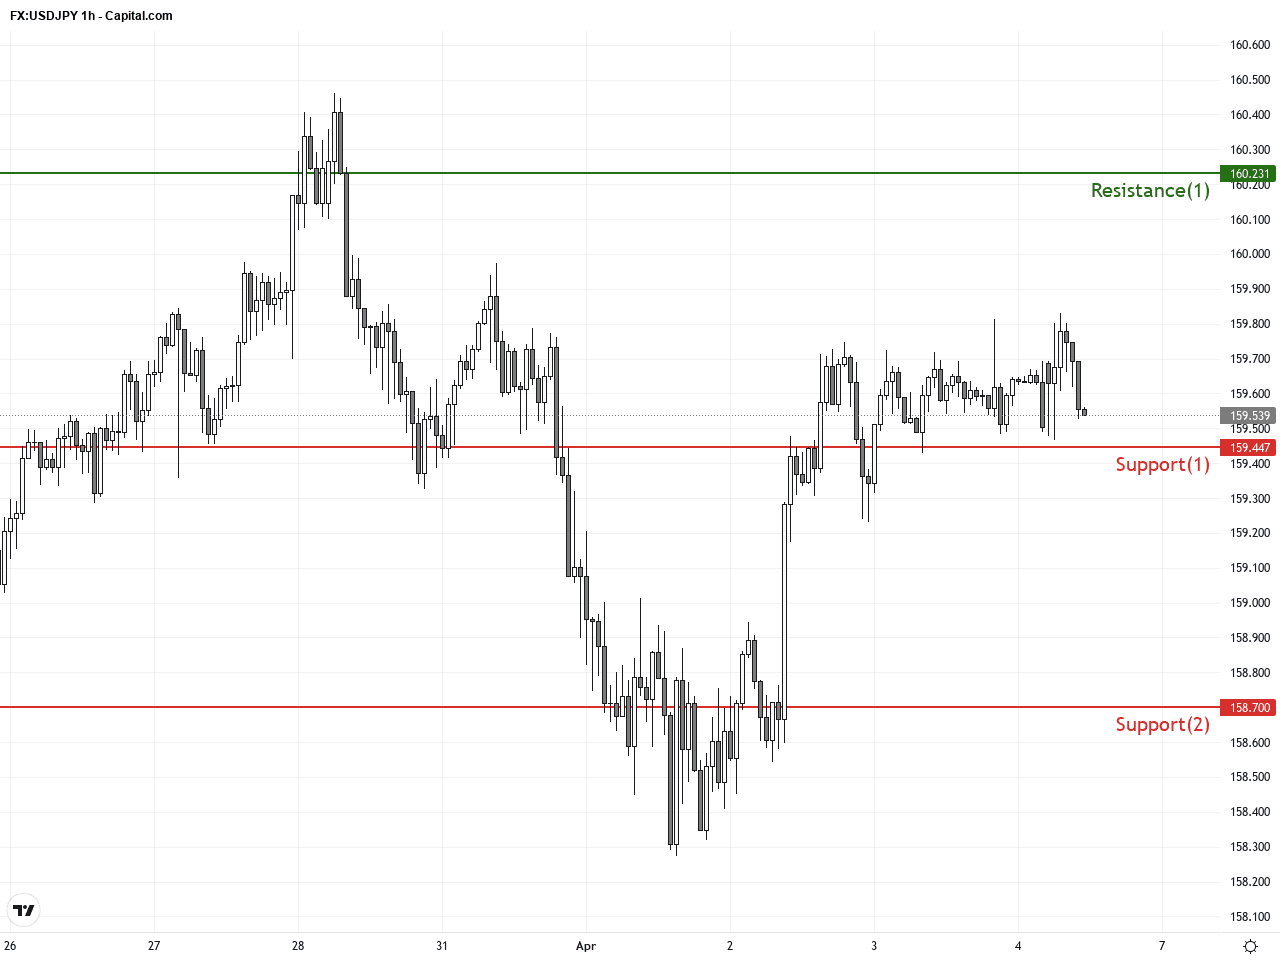
Resistance & Support
The above financial market data, quotes, charts, statistics, exchange rates, news, research, analysis, buy or sell ratings, financial education, and other information are for reference only. Before making any trades based on this information, you should consult independent professional advice to verify pricing data or obtain more detailed market information. 1uptick.com should not be regarded as soliciting any subscriber or visitor to execute any trade. You are solely responsible for all of your own trading decisions.