


 |
| Gold V.1.3.1 signal Telegram Channel (English) |
WTI Crude Oil: Geopolitical Risks Fuel Rally as Technical Breakout Looms
2026-04-30 @ 06:03
Over the past 48 hours, WTI crude oil prices have experienced significant volatility, rising from a closing price of $106.88 on April 29 to above $111 recently, showing strong upward momentum. This price surge is primarily driven by escalating supply risks in the Strait of Hormuz, stalled U.S.-Iran negotiations, and disruptions to tanker movements, raising concerns about oil supply.
According to the latest market news, former President Trump’s vow to blockade Iran has further amplified supply worries. The Strait of Hormuz accounts for about 20% of global oil shipments, and any disruptions in this key route can cause sharp price fluctuations. Moreover, the stalemate in U.S.-Iran talks has deepened market uncertainty, prompting investors to remain cautious about future supply stability.
For everyday investors, this means that oil prices, which would typically be more stable, have been propelled by geopolitical tensions, making near-term prices unlikely to retreat. If you hold oil-related assets or energy sector stocks, these short-term swings could present both opportunities and risks. Monitoring developments in the Middle East and policy changes remains essential.

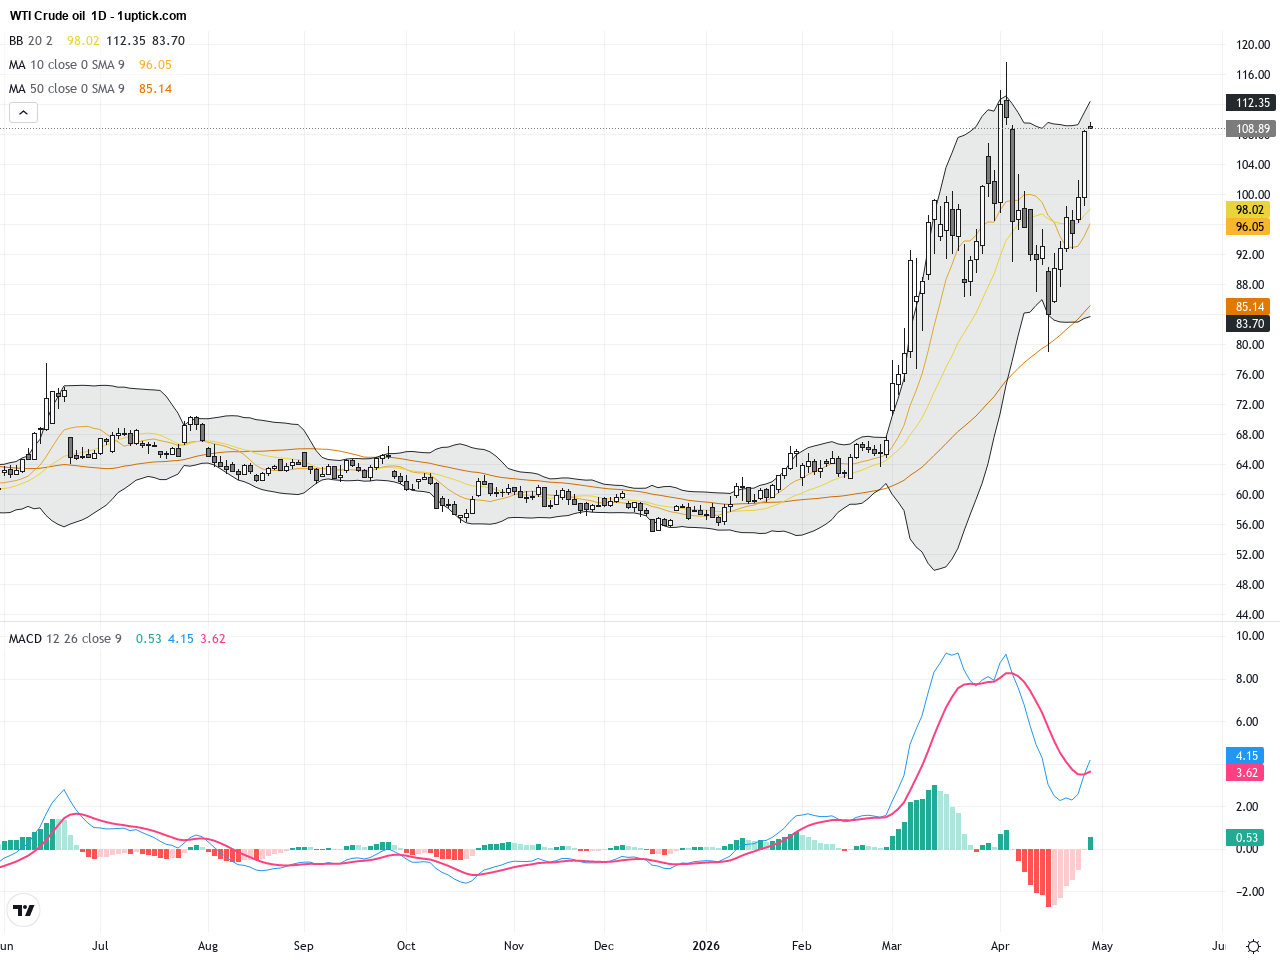
The daily chart reveals a sustained uptrend for WTI Crude Oil since mid-April, with prices progressively rising from approximately $90 towards the recent highs near $108. The Bollinger Bands have widened, indicating increased volatility. Moving averages (20-day and 50-day) are in a bullish alignment supporting the uptrend. The MACD indicator shows expanding positive momentum, confirming robust buying interest. Overall, the longer-term technical trend is bullish and signals continued strength.
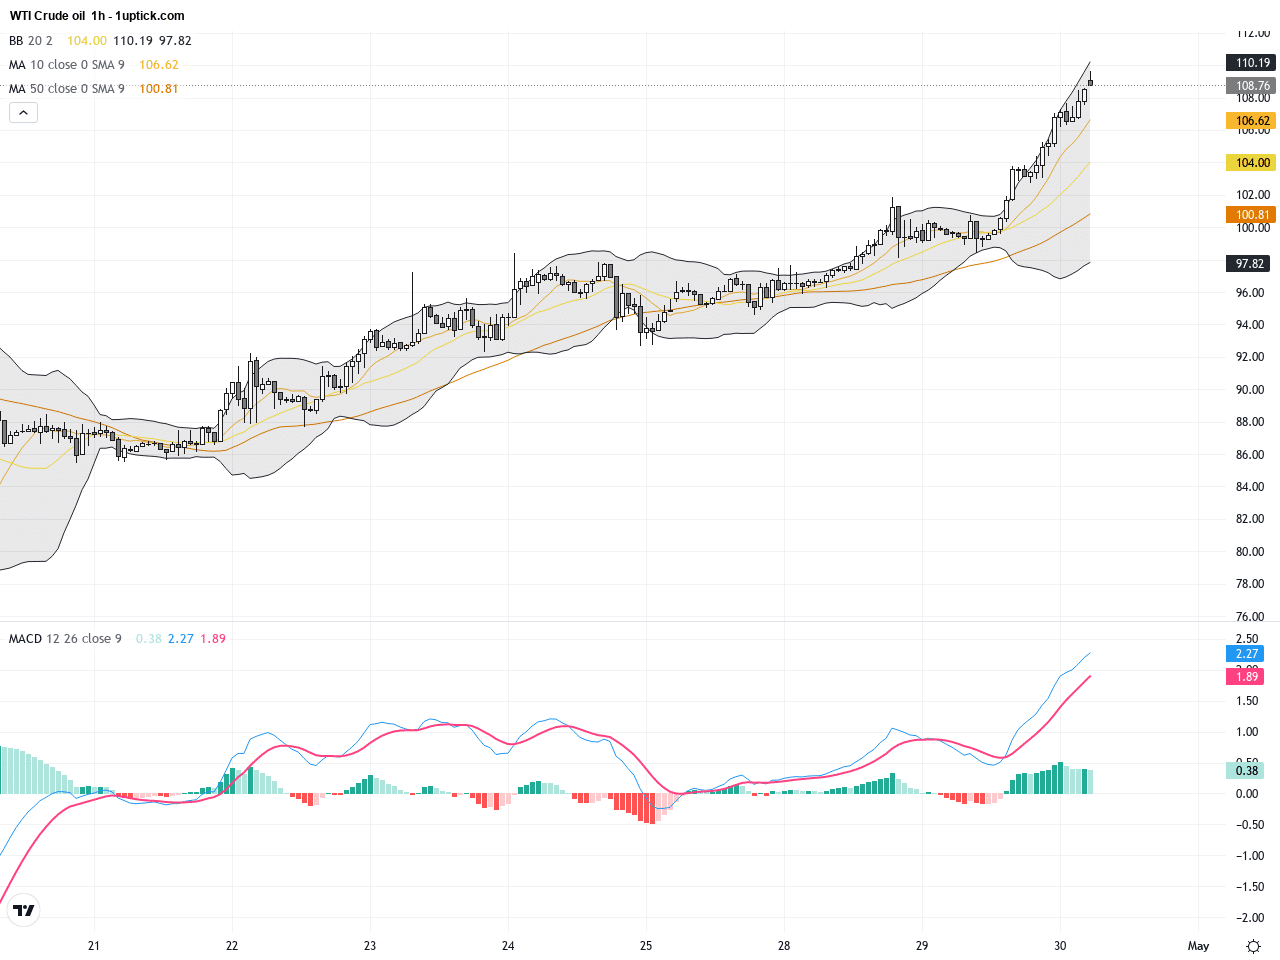
The hourly chart over the past 3-5 days shows WTI fluctuating within a clear upward channel after a brief pullback to around $101 support, followed by strong rebounds. Short-term moving averages (9-hour and 21-hour) have formed bullish crossovers indicating strong near-term momentum. However, a mild bearish divergence on the MACD suggests possible short-term consolidation or correction ahead. The Bollinger Band midline offers firm short-term support, with prices likely oscillating between $103 and $108 in the near term.
Technical Trend: WTI Crude Oil is in a decisively bullish trend.
Current technical signals for WTI show a breakout from recent consolidation, with expanding MACD histogram bars signaling strong bullish momentum on the daily chart. The appearance of a bullish engulfing candlestick pattern supports continued upside in the next 24 hours. Nonetheless, the hourly MACD divergence warns of a short-term pullback, presenting a potential high-probability trade entry point. Combined with ongoing geopolitical tensions, technical analysis provides a solid foundation supporting further price gains.There are no significant or directly relevant economic events scheduled today that are expected to impact WTI Crude Oil prices. Traders should focus on geopolitical news and global supply dynamics as the primary market drivers.
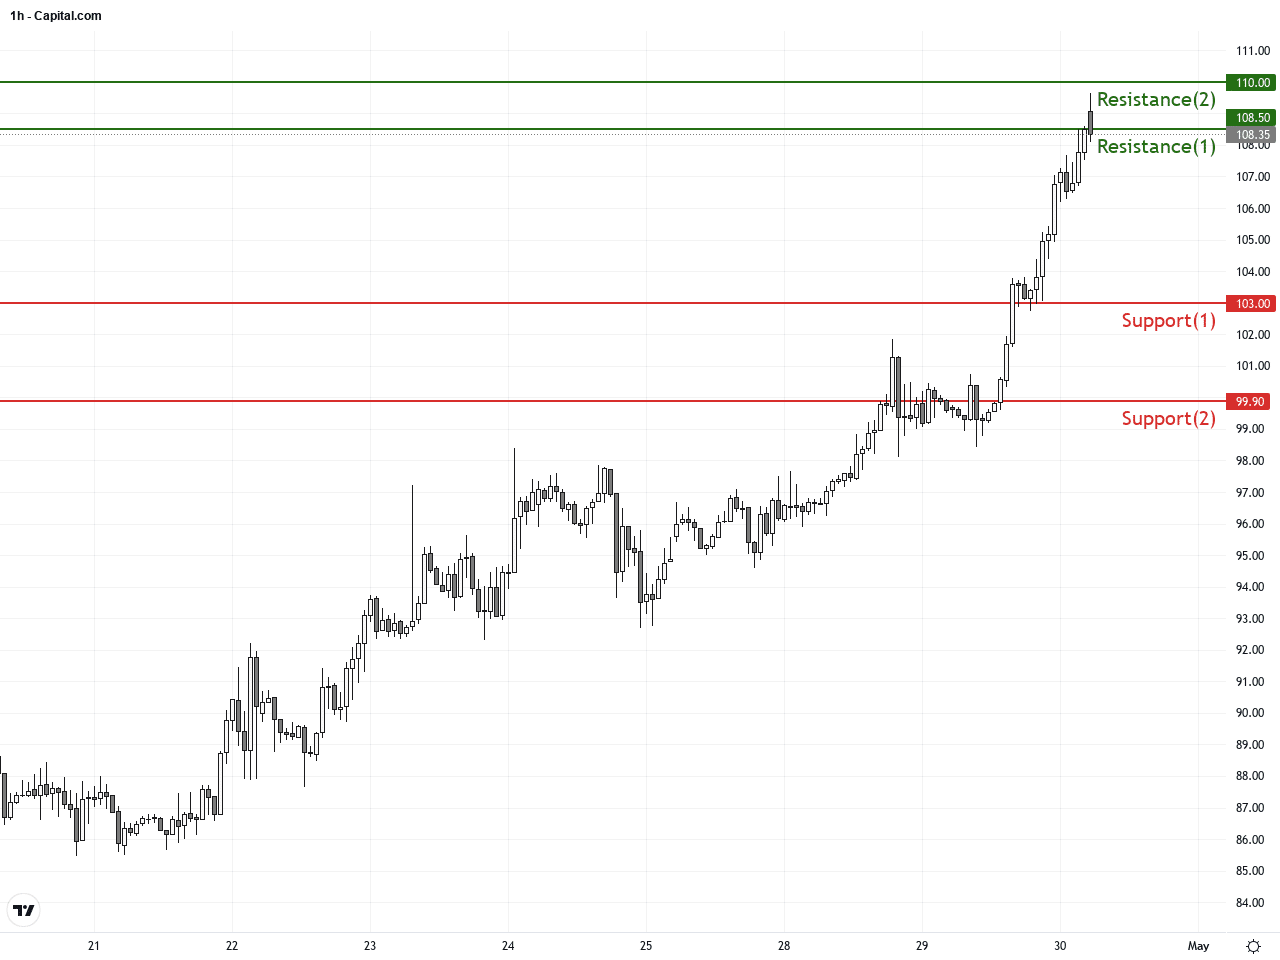
Resistance & Support
The above financial market data, quotes, charts, statistics, exchange rates, news, research, analysis, buy or sell ratings, financial education, and other information are for reference only. Before making any trades based on this information, you should consult independent professional advice to verify pricing data or obtain more detailed market information. 1uptick.com should not be regarded as soliciting any subscriber or visitor to execute any trade. You are solely responsible for all of your own trading decisions.