


 |
| Gold V.1.3.1 signal Telegram Channel (English) |

USDJPY Breaks Key 159 Resistance with Bullish Technical Patterns
2026-04-22 @ 11:01
Over the past 24 to 48 hours, the USD/JPY exchange rate showed a notable upward trend influenced primarily by geopolitical uncertainties between the U.S. and Iran. After closing around 159.35 yesterday, USD/JPY demonstrated strength on Tuesday, reaching as high as 159.65 before settling near 159.40, marking a modest 0.37% gain compared to yesterday’s close.
The market has been focused on the stalemate in U.S.-Iran negotiations, which dampened risk appetite and favored the dollar. Additionally, stronger-than-expected U.S. retail sales data provided additional support to the greenback. Meanwhile, ongoing uncertainty over the Bank of Japan’s policy outlook pressured the yen, further bolstering USD/JPY.
For the average investor, this dynamic plays out like a global geopolitical risk game: as tensions between the U.S. and Iran escalate, demand for safe-haven currencies pushes the dollar higher, while the yen struggles due to the BOJ’s accommodative stance. Investors should note that recent USD/JPY moves are driven more by significant political events and economic reports than technical factors.

The daily chart shows a clear uptrend with USDJPY steadily rising from recent lows and breaking above both the 50-day and 200-day moving averages, confirming a solid medium-to-long-term bullish trend. Bollinger Bands are expanding, indicating increased volatility, while the MACD remains in positive territory, supporting further upward momentum. After hitting resistance near 159.65, the price saw a minor pullback, but key moving average supports remain intact, suggesting favorable conditions for buying on dips.
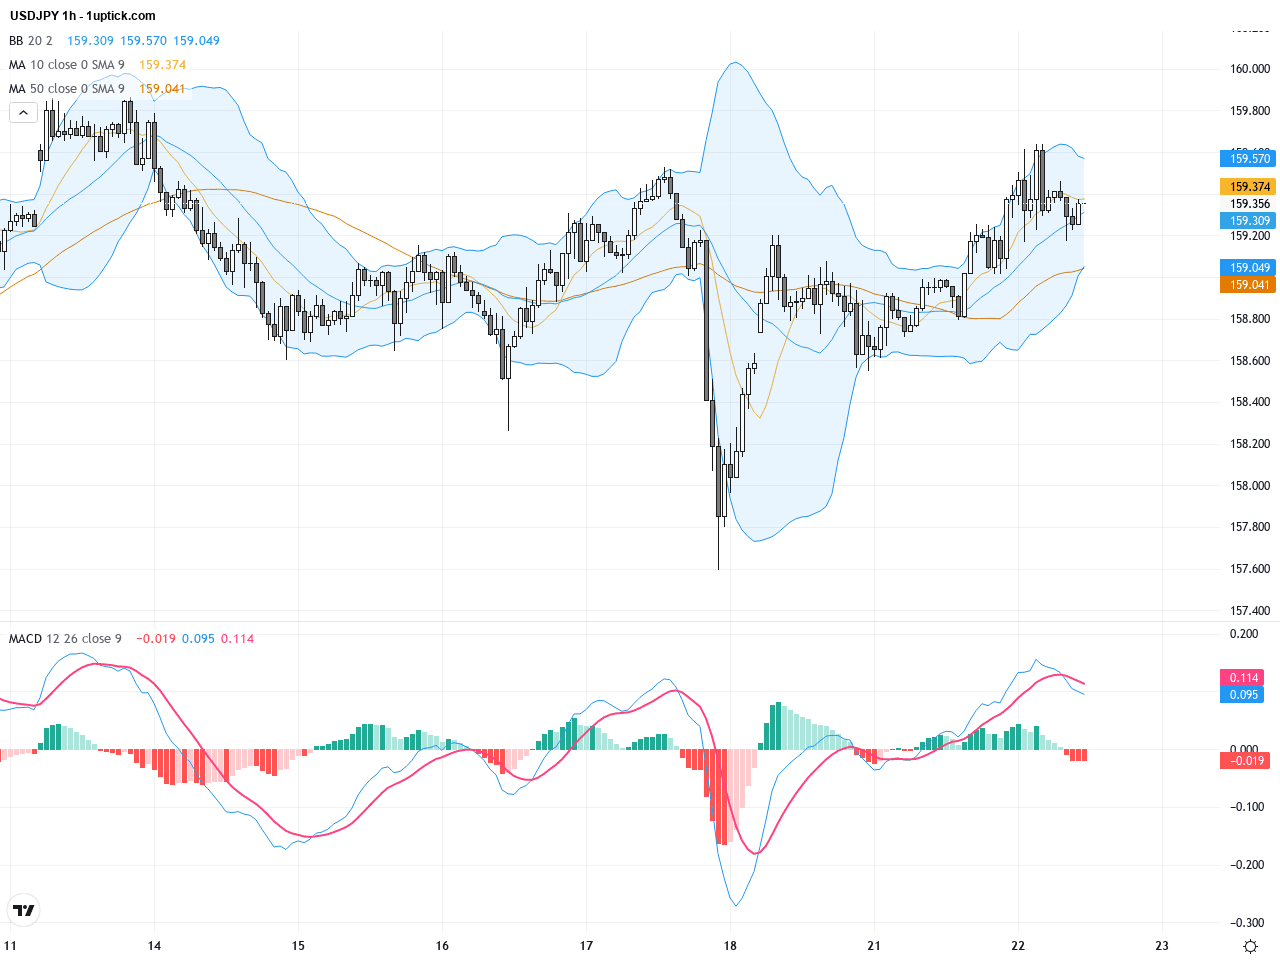
On the hourly chart spanning the past 3-5 days, USDJPY exhibits a strong impulsive uptrend. Price is consistently supported by short-term moving averages. The MACD has recently completed a bullish crossover, signaling increasing momentum. The mid Bollinger Band is providing firm support, and a bullish engulfing candlestick pattern was formed recently, indicating the likelihood of continuation within the next 24 hours. Traders should watch for minor retracements as potential entry points.
Technical Trend: USDJPY is in a firm uptrend, best described as definitively bullish, with strong momentum and positive market sentiment favoring the dollar against the yen.
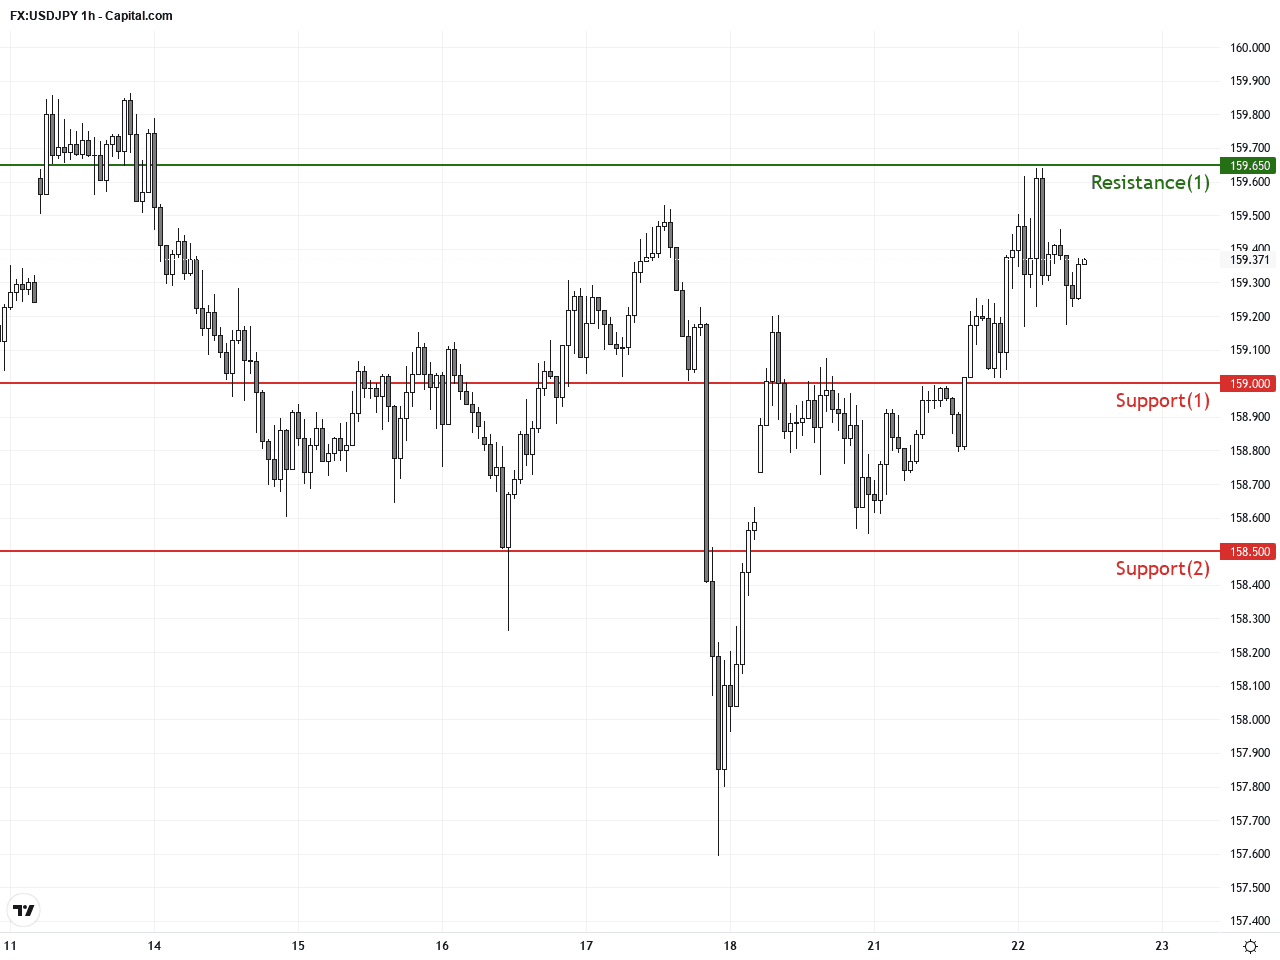
USDJPY is currently shaped by a major Head and Shoulders bottom pattern, which began to form in early March near lows. The neckline at approximately 158.50 was decisively broken, confirming bullish continuation. The recent bullish engulfing candlestick strengthens the case for further upside. MACD bullish crossover and Bollinger Band expansion confirm rising momentum. Short-term traders should focus on break and retest around 159.40-159.65 with risk controls to avoid potential false breakouts.Today’s Japanese trade balance data released at 01:50 GMT+1 showed a significant miss against forecasts (667 billion JPY vs. expected 1100 billion), weighing on the yen. Although exports grew 11.7% year-on-year and imports grew 10.9%, the reduced trade surplus adds pressure on JPY. This negative data point is likely to support further USDJPY strength in the short term. Other global events, such as UK inflation releases, hold limited direct impact on USDJPY today, resulting in no major economic events expected to cause volatility in this pair.
Resistance & Support
The above financial market data, quotes, charts, statistics, exchange rates, news, research, analysis, buy or sell ratings, financial education, and other information are for reference only. Before making any trades based on this information, you should consult independent professional advice to verify pricing data or obtain more detailed market information. 1uptick.com should not be regarded as soliciting any subscriber or visitor to execute any trade. You are solely responsible for all of your own trading decisions.