

 |
| Gold V.1.3.1 signal Telegram Channel (English) |
WTI Crude Oil: Iran Ceasefire Sparks Sharp Drop, Key Support and Rebound Analysis
2026-04-09 @ 06:03
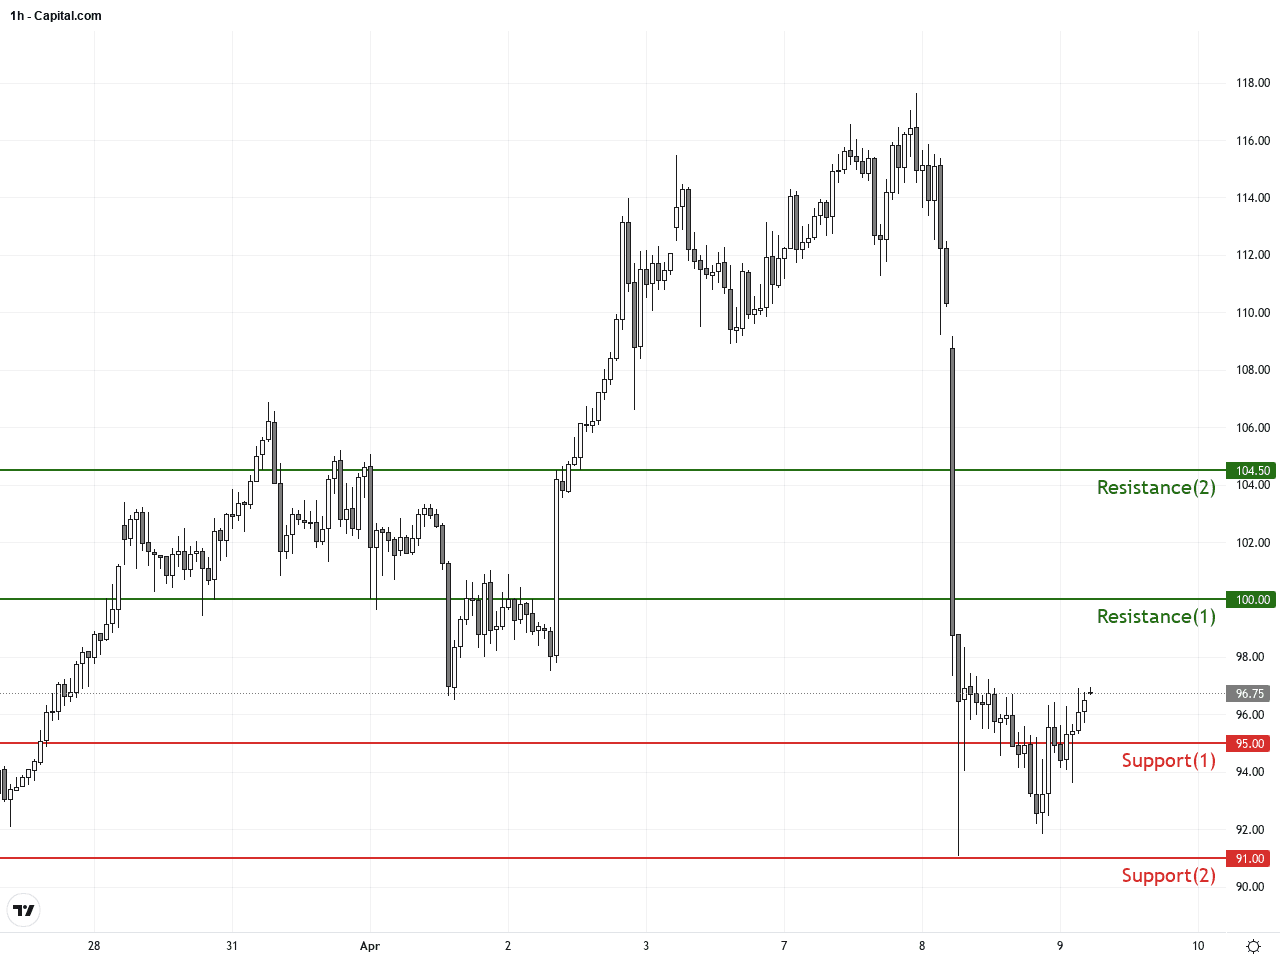
Over the past 24 to 48 hours, the WTI crude oil market experienced significant volatility. After the announcement of a two-week ceasefire between the US and Iran on April 7, oil prices plunged more than 16% from the April 7 closing price of $112.95 to close at $96.5 on April 8, marking one of the largest single-day declines in recent years.
This news directly eased supply concerns in the Gulf region, particularly in the Strait of Hormuz, significantly reducing fears of disruption. For the average investor, it’s like suddenly receiving reassurance that fuel supplies won’t be cut off, triggering a rapid price drop and a sharp shift in market sentiment.
While the ceasefire boosted global equity markets, with the Dow experiencing its best day in a year, the oil market’s sharp moves serve as a reminder that geopolitical risks persist. However, the immediate risk relief led to a swift price recalibration in the energy sector.
In summary, the recent market news and wild oil price swings illustrate a scenario where global energy markets remain highly sensitive to conflict-related risks, but ceasefire hopes have quickly restored confidence, leading to a major correction in WTI crude prices within a short time.
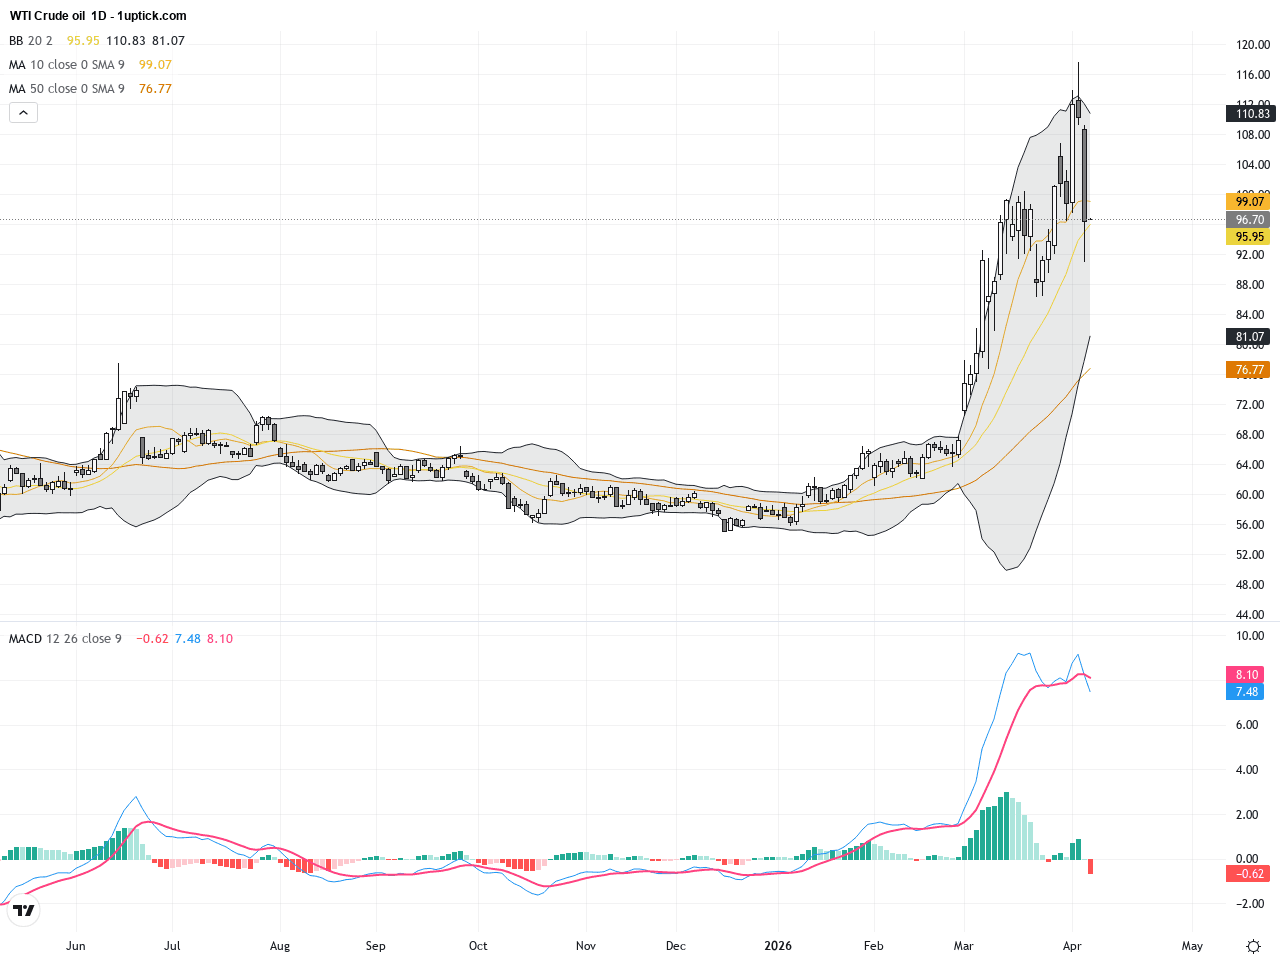
On the daily chart, WTI Crude maintained an overall uptrend since late March, peaking near $118. However, starting April 7th, a sharp selloff pushed prices below recent moving average supports. The Bollinger Bands show a breakout below the lower band, and the MACD has turned negative, signaling increasing bearish momentum. The trend is shifting from bullish to a correction phase, with a clear downward channel forming. Watch for support around $95 to gauge potential bounce levels.
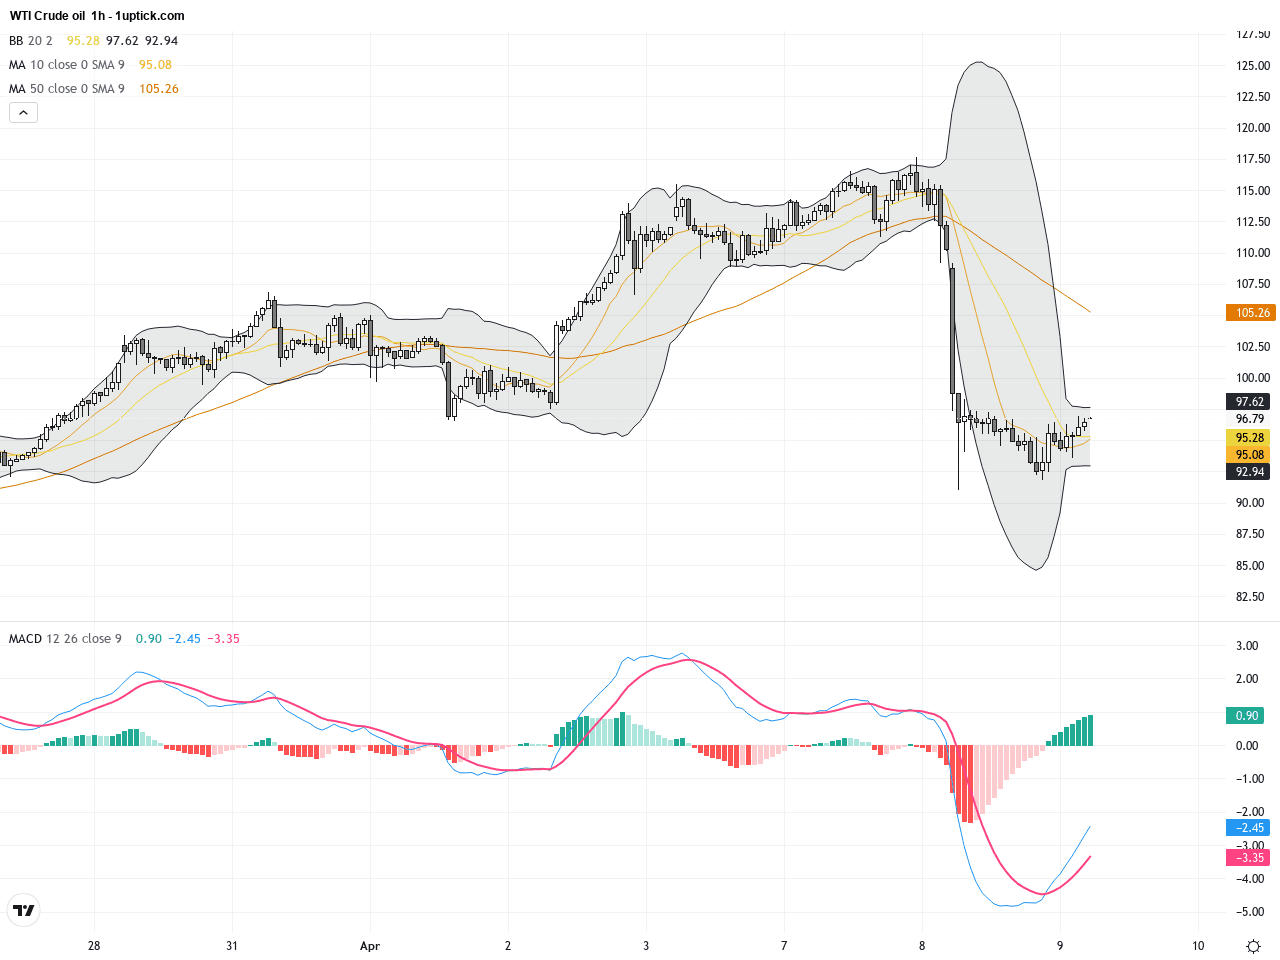
Looking at the hourly chart over the past 3–5 days, price action has been highly volatile, with a significant drop on April 8. The Bollinger Bands widened rapidly, reflecting increased market uncertainty. Recent price action shows attempts to stabilize near $96, with short-term EMAs beginning to converge and MACD histogram shrinking, indicating selling pressure easing. A short-term base appears to be forming, and a break above $100 resistance could trigger a rebound.
Technical Trend: WTI Crude Oil is currently in a cautiously bearish phase with potential for short-term consolidation or rebound.
Technically, WTI Crude is at a critical junction. The daily MACD bearish crossover confirms a short-term downtrend, but the hourly chart shows potential signs of reversal with converging short-term averages. The key candlestick to watch is the April 8 long lower shadow bearish candle, suggesting strong selling followed by buyer support. Coupled with the Iran ceasefire news, this could facilitate a short-term technical rebound. However, failure to surpass major resistance levels may lead to continued downside pressure.There are no major economic events today directly impacting WTI Crude Oil. Hence, short-term price movements will primarily be influenced by geopolitical developments and technical factors. Traders should continue to monitor supply-demand dynamics and any sudden news.
Resistance & Support
The above financial market data, quotes, charts, statistics, exchange rates, news, research, analysis, buy or sell ratings, financial education, and other information are for reference only. Before making any trades based on this information, you should consult independent professional advice to verify pricing data or obtain more detailed market information. 1uptick.com should not be regarded as soliciting any subscriber or visitor to execute any trade. You are solely responsible for all of your own trading decisions.