


 |
| Gold V.1.3.1 signal Telegram Channel (English) |
WTI Crude oil: US-Iran Talks Spark Volatility, Key Support Levels in Focus
2026-04-16 @ 06:03
Over the past 48 hours, WTI crude oil prices have experienced significant volatility, closing at $91.29 on April 15, nearly unchanged from the previous day. The market was heavily influenced by recent developments in US-Iran talks, shifting investor sentiment from tense to cautiously optimistic. With the second round of US-Iran peace negotiations moving to Pakistan, oil prices plunged about 8% in a sharp intraday move, reflecting easing concerns over supply risks.
Moreover, since the closure of the Strait of Hormuz at the end of February, global oil markets have been unsettled, impacting transport routes and pricing structures. Reports highlight that while major energy companies like ExxonMobil draw attention, the smartest trade in 2026 may be investing in companies owning the land beneath oil production sites, as geopolitical risks make physical oil supply increasingly valuable.
For the average investor, the recent price turbulence underscores the importance of monitoring geopolitical events and diplomatic talks closely, as these will directly affect crude oil supply and price trends. The market currently anticipates clearer peace agreements, resulting in ongoing uncertainty that impacts not only WTI but the broader global energy sector sentiment.

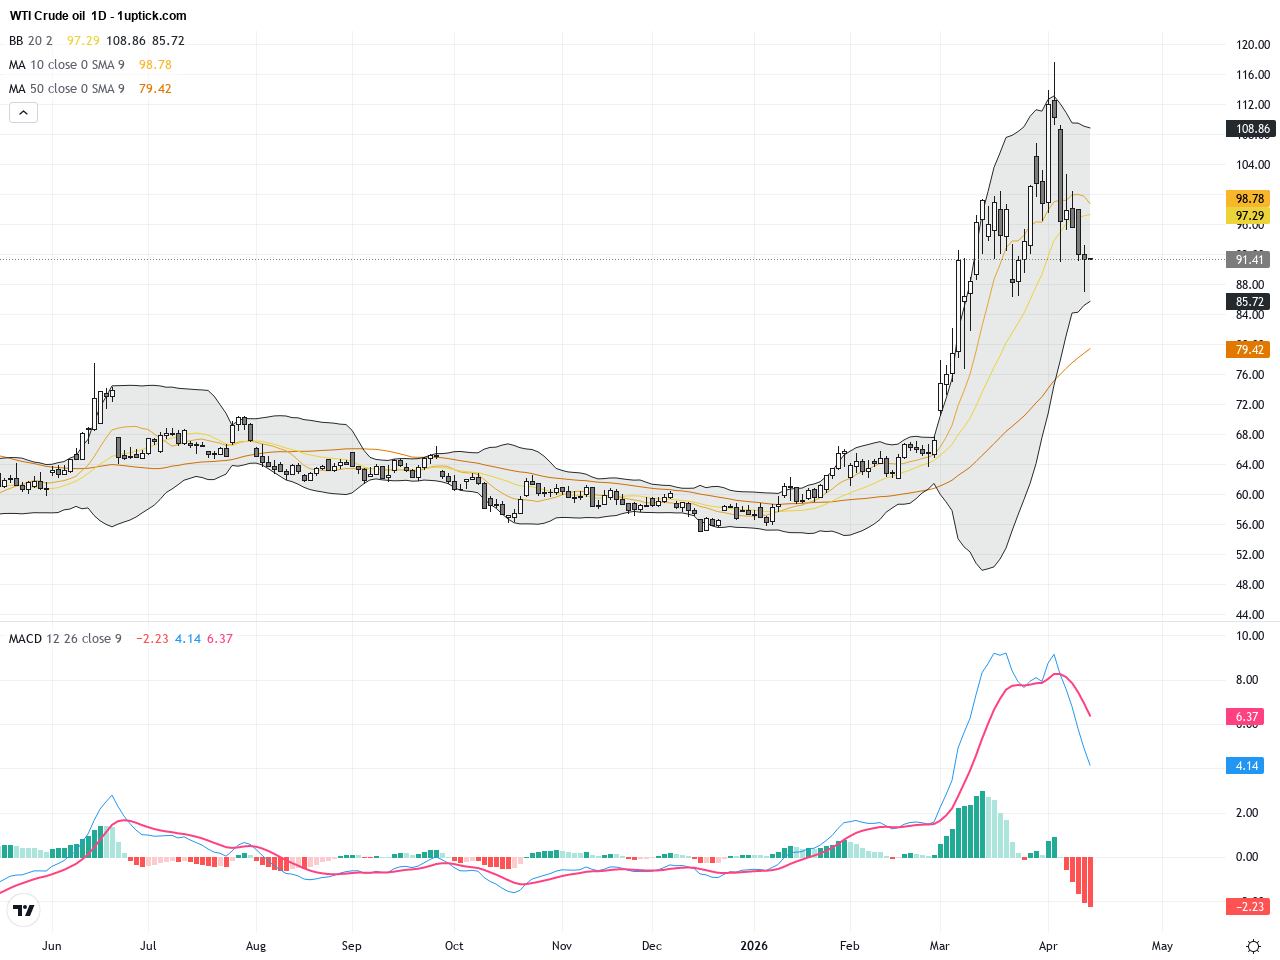
The daily chart shows WTI Crude oil retreating from April highs near $112. The price has been oscillating between $91 and $99 in recent sessions. Moving averages indicate prices currently trading below short-term averages, signaling ongoing bearish momentum. Bollinger Bands are contracting, suggesting diminishing volatility but potential for a breakout. MACD is weakening with shrinking bearish histograms, highlighting persistent downside pressure. Overall, the daily chart implies the attempts to reclaim gains face strong resistance and the trend remains tilted to the downside.
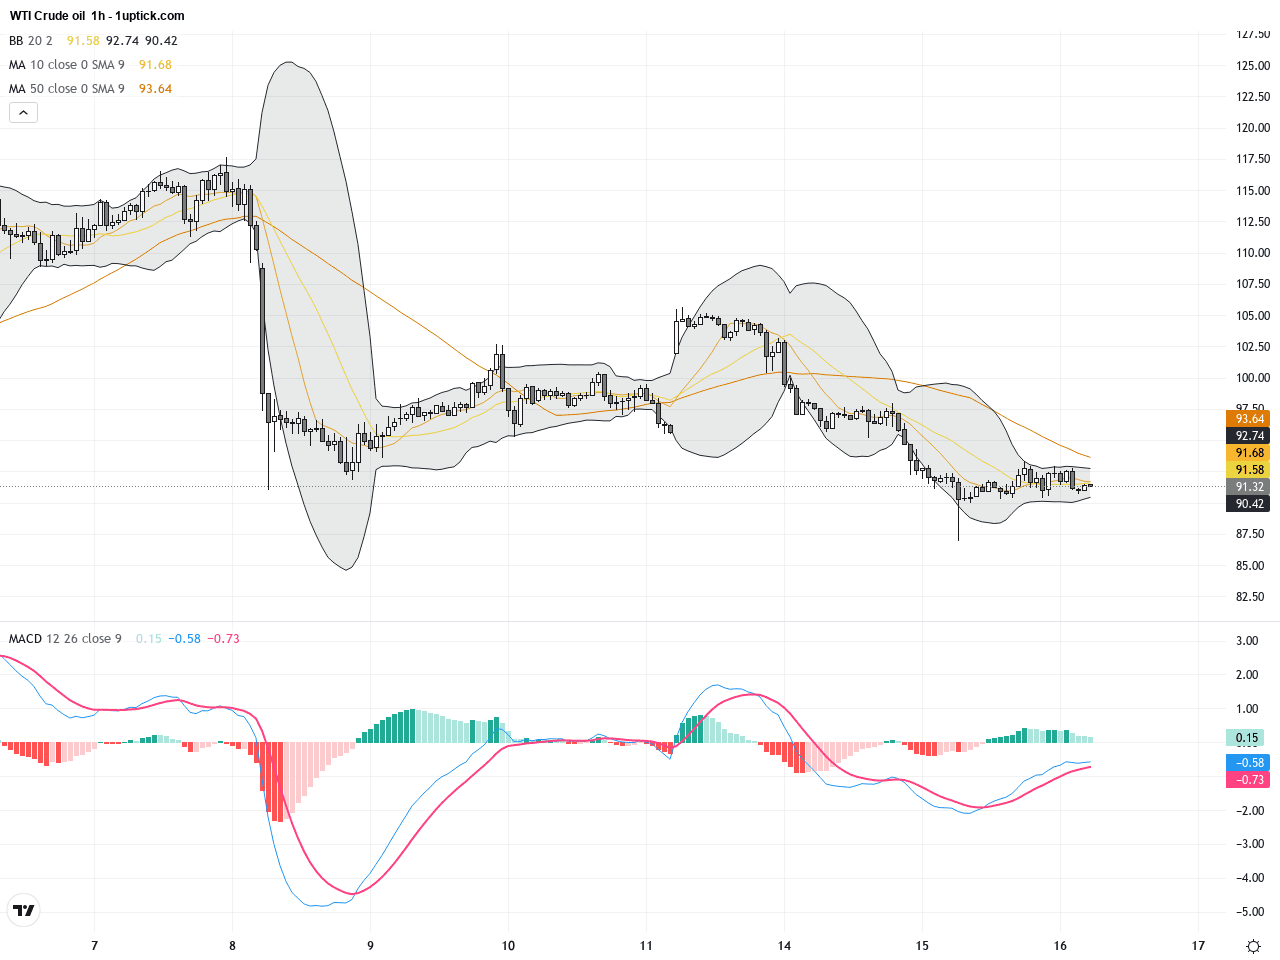
Hourly analysis reveals WTI testing the critical $90 psychological support multiple times over the past 3-5 days. Several hammer candlesticks have emerged, suggesting underlying buyer presence at this level. Short-term moving averages show brief bullish crossovers but on low volume, indicating limited strength in rallies. Bollinger Bands have tightened and MACD hovers near zero, reflecting indecision and congestion. The price action signals a near-term tug-of-war, urging caution for traders watching breakout directions.
Technical Trend: Cautiously Bearish
Key technical insights on WTI Crude oil include a weakening MACD on the daily chart and Bollinger Bands contraction signaling a consolidation phase. On the hourly chart, repeated tests of the $90 support followed by hammer candlesticks suggest potential short-term rebounds. However, overall bearish pressure and low volume temper optimism. Traders should monitor geopolitical developments closely and use critical support and resistance levels to guide entries and exits.There are no significant or directly relevant economic events today in the GMT+1 calendar that would impact WTI Crude oil prices. Market focus remains on geopolitical developments and US-Iran negotiations which will continue to influence price dynamics in the near term.
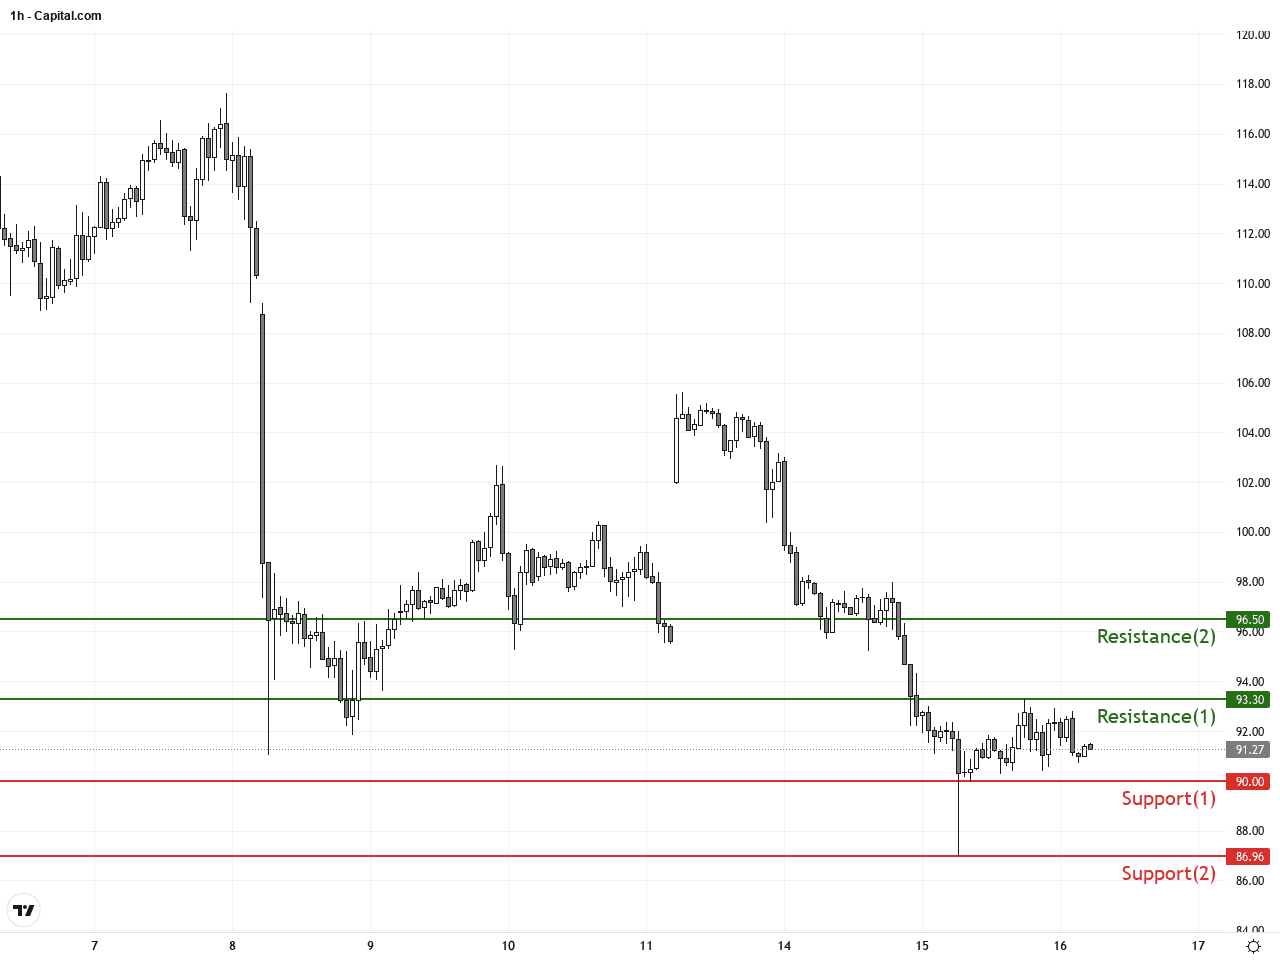
Resistance & Support
The above financial market data, quotes, charts, statistics, exchange rates, news, research, analysis, buy or sell ratings, financial education, and other information are for reference only. Before making any trades based on this information, you should consult independent professional advice to verify pricing data or obtain more detailed market information. 1uptick.com should not be regarded as soliciting any subscriber or visitor to execute any trade. You are solely responsible for all of your own trading decisions.