

 |
| Gold V.1.3.1 signal Telegram Channel (English) |
XAUUSD: Gold Price Faces Resistance Below 50-Day Moving Average Amid Dollar Strength
2026-04-21 @ 05:04
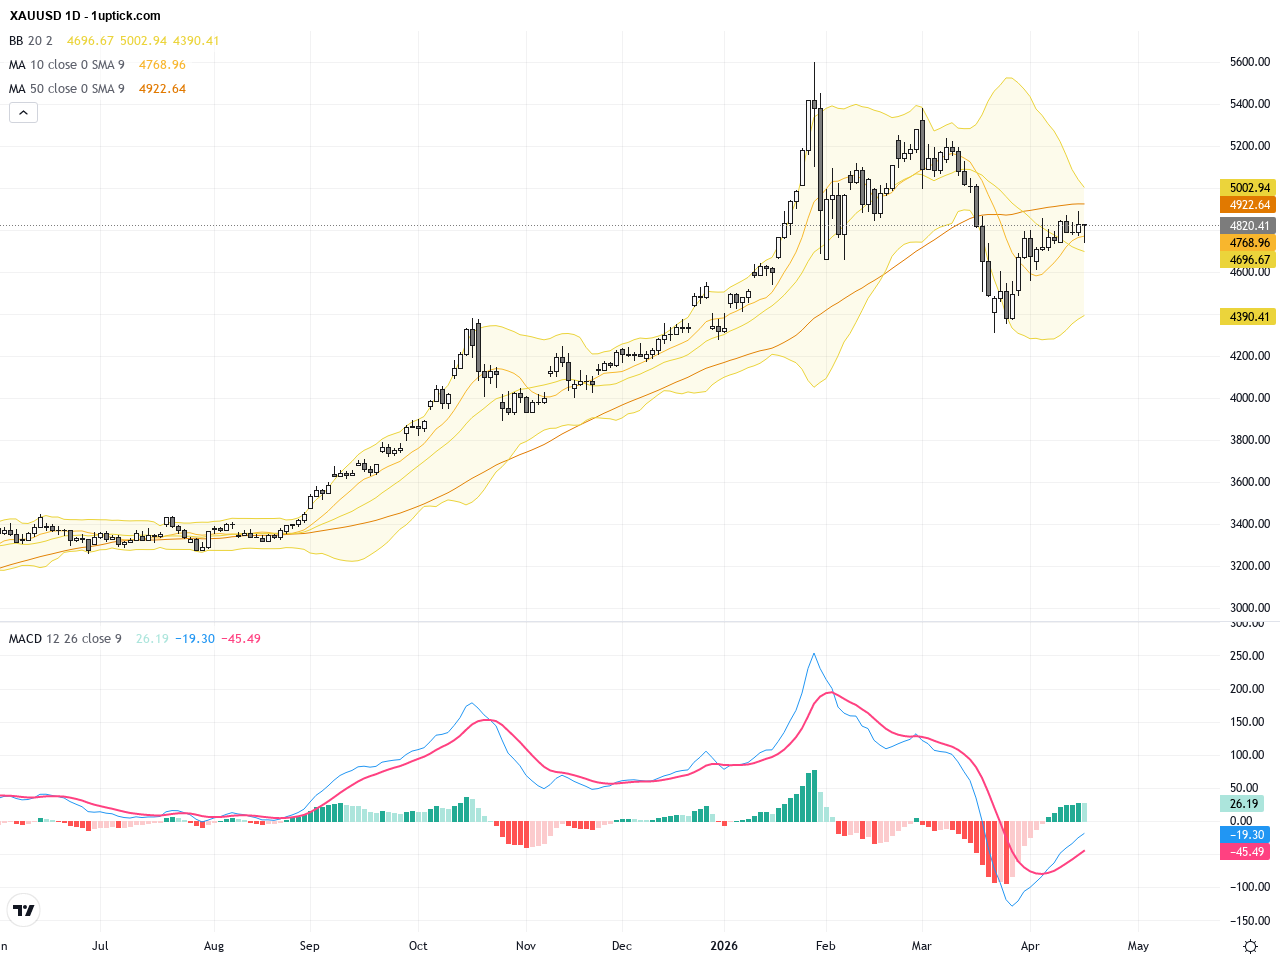
Over the past 24 to 48 hours, gold prices (XAUUSD) have seen a slight pullback, with yesterday’s closing price at $4818.33. Market sentiment has been influenced by multiple factors recently. Despite a stronger US dollar and renewed tensions between the US and Iran boosting the dollar and yields, gold prices have been pressured and failed to break above the 50-day moving average resistance.
However, analysts note that despite this recent correction in gold and silver prices, the long-term fundamentals remain robust. Gold continues to benefit from macroeconomic tailwinds, especially persistent geopolitical risks and inflation concerns, maintaining its safe-haven status amid market volatility. Traders remain attentive to dollar movements and yield trends, as the strength of the dollar directly affects gold’s appeal.
For investors, the recent slight dip in gold prices may bring short-term uncertainty, but gold’s value as a risk hedge remains intact. Given ongoing global political tensions and potential fluctuations in the dollar, gold continues to be seen as an ideal choice for risk protection and wealth preservation.

The daily chart reveals a longer-term uptrend for XAUUSD with recent resistance encountered around the 50-day moving average. Bollinger Bands are narrowing, indicating reduced volatility, and the MACD shows signs of bearish crossover suggesting short-term selling pressure. The moving averages still provide support but a sustained stay below the 50-day line could raise risk of a medium-term correction.
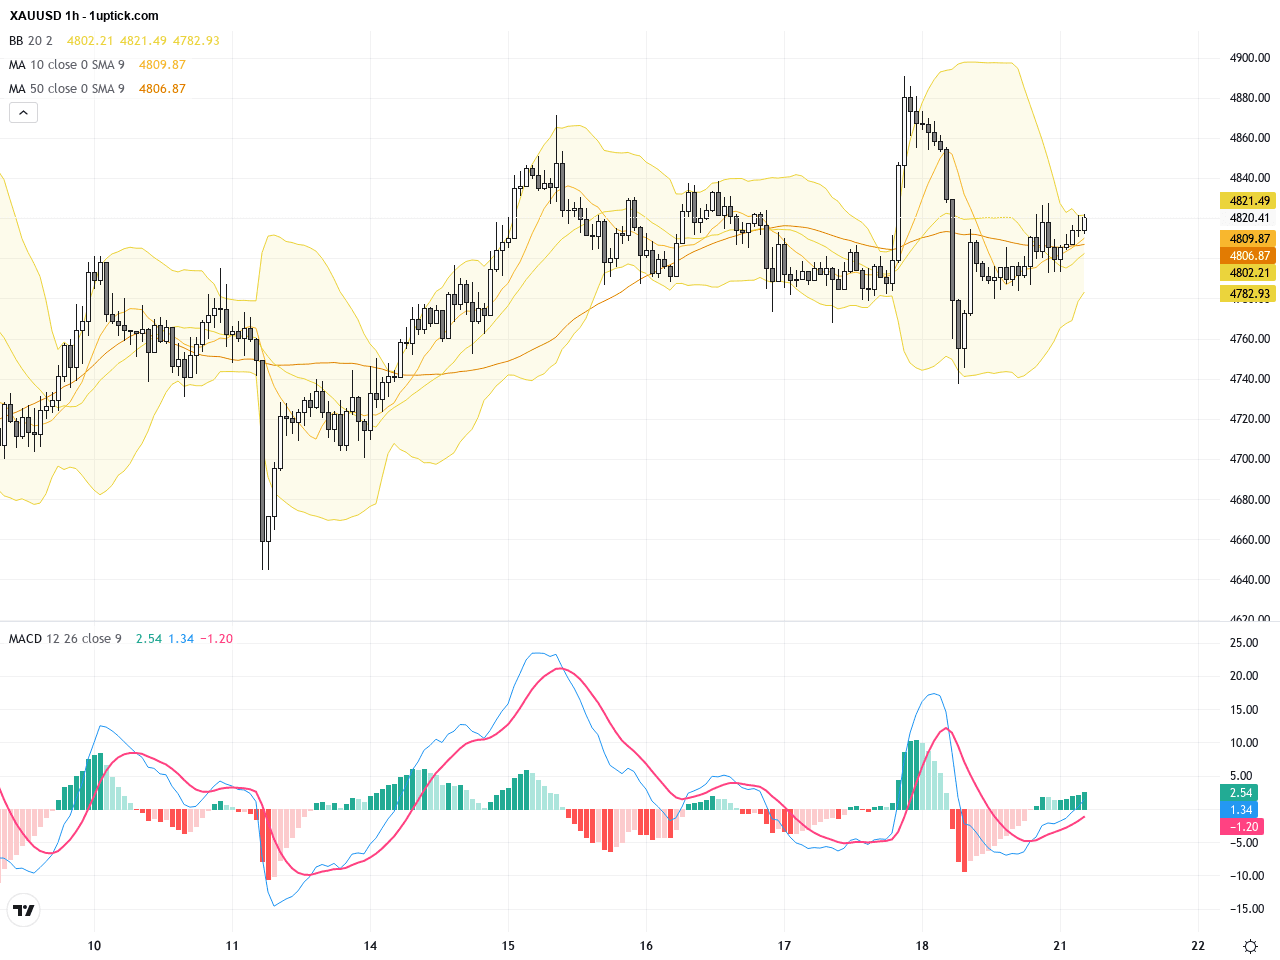
The hourly chart over the past 3-5 days shows XAUUSD in a consolidation phase with price oscillating between moving averages. Trading below the Bollinger Bands middle line and with a negative MACD momentum, the short-term trend is weak. No decisive breakout is evident yet, so traders should carefully watch support and resistance tests for timely entries.
Technical Trend: The current trend for XAUUSD is ‘Cautiously Bearish,’ with short-to-medium term pressure alongside intact long-term bullish structures.
Technically, a short-term head and shoulders pattern appears forming on the daily chart, suggesting possible bearish reversal if the neckline support breaks decisively. Hourly charts show consecutive bearish candles and a negative MACD crossover indicating strengthening selling momentum. However, key support confluence zones near the lower Bollinger band could facilitate short-term rebounds, making volume and moving average crossover critical for execution timing.Today’s (GMT+1) economic calendar highlights Canadian core and headline Consumer Price Index data for March, highly relevant to USD and CAD movements influencing gold prices. Slightly higher inflation figures are expected to impact currency valuations, indirectly affecting XAUUSD. Additionally, remarks from the European Central Bank Chairman may add volatility. Traders should monitor these events post 14:30 GMT+1 for potential gold market impact.
Resistance & Support

The above financial market data, quotes, charts, statistics, exchange rates, news, research, analysis, buy or sell ratings, financial education, and other information are for reference only. Before making any trades based on this information, you should consult independent professional advice to verify pricing data or obtain more detailed market information. 1uptick.com should not be regarded as soliciting any subscriber or visitor to execute any trade. You are solely responsible for all of your own trading decisions.