

 |
| Gold V.1.3.1 signal Telegram Channel (English) |
XAUUSD: Gold Price Stalls Below 50-Day MA as Key Support and Resistance Levels Guide Trading Outlook
2026-04-23 @ 05:04
Over the past 24 to 48 hours, gold (XAUUSD) experienced notable volatility, closing around $4738.61 per ounce, slightly down from the previous day. Market news highlighted a temporary ceasefire agreement between the US and Iran that triggered a sharp rally in gold prices, as investors flocked to the metal as a safe haven. However, this rally lacked follow-through, restrained by a strong US dollar and hawkish comments from Federal Reserve official Warsh, preventing a lasting breakout.
In simple terms, the recent gold price action resembles a tense tug-of-war: the Iran ceasefire provided momentary relief akin to a brief pause in a battlefield, yet the strength of the dollar and rising interest rate expectations acted as counterforces holding gold back. For average investors, this means that while gold remains a favored safe asset, its price movements are heavily influenced by the interplay of geopolitical developments and dollar strength, calling for close attention to such news to navigate short-term volatility.
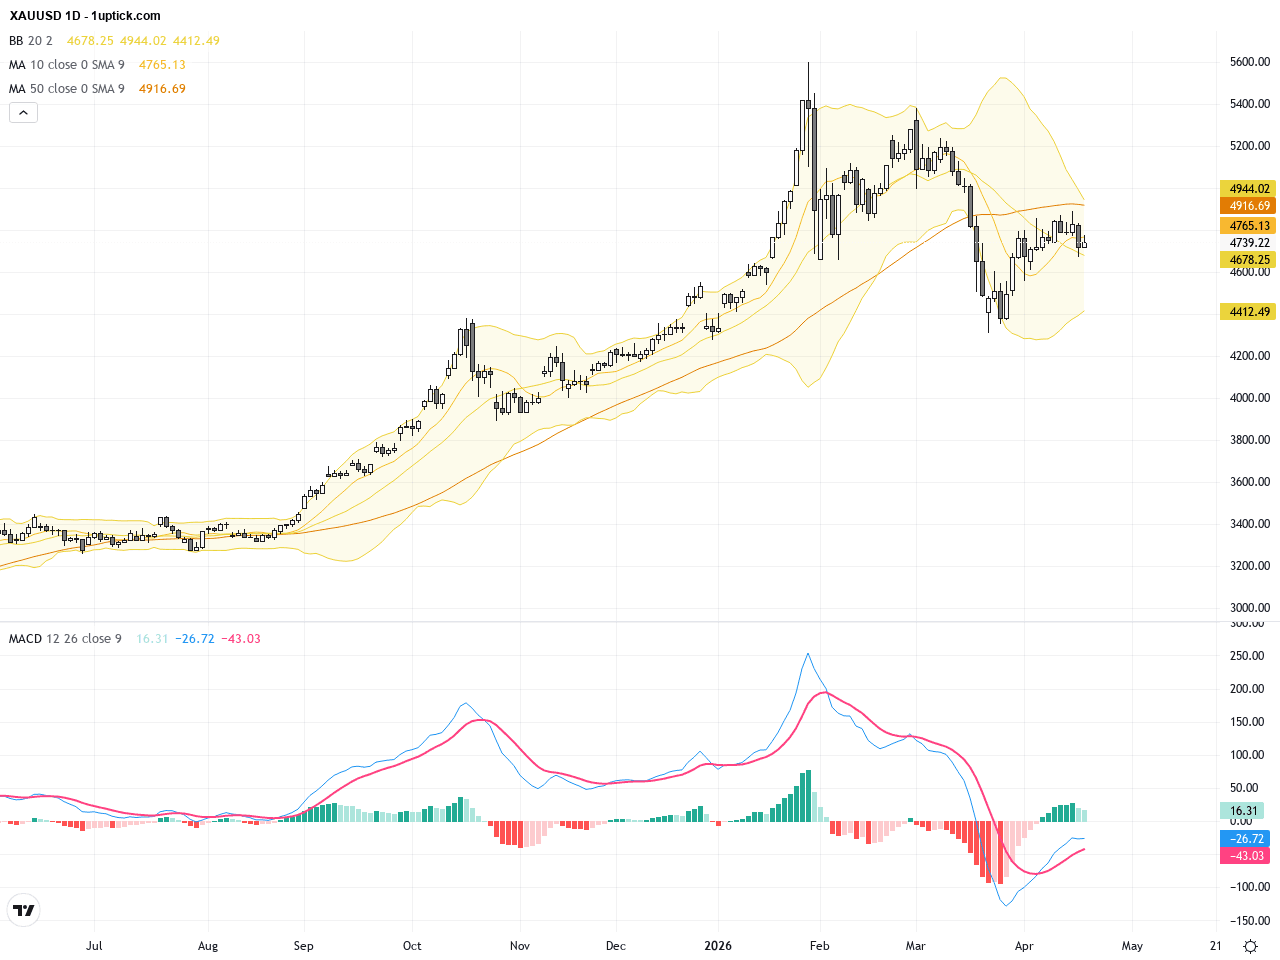
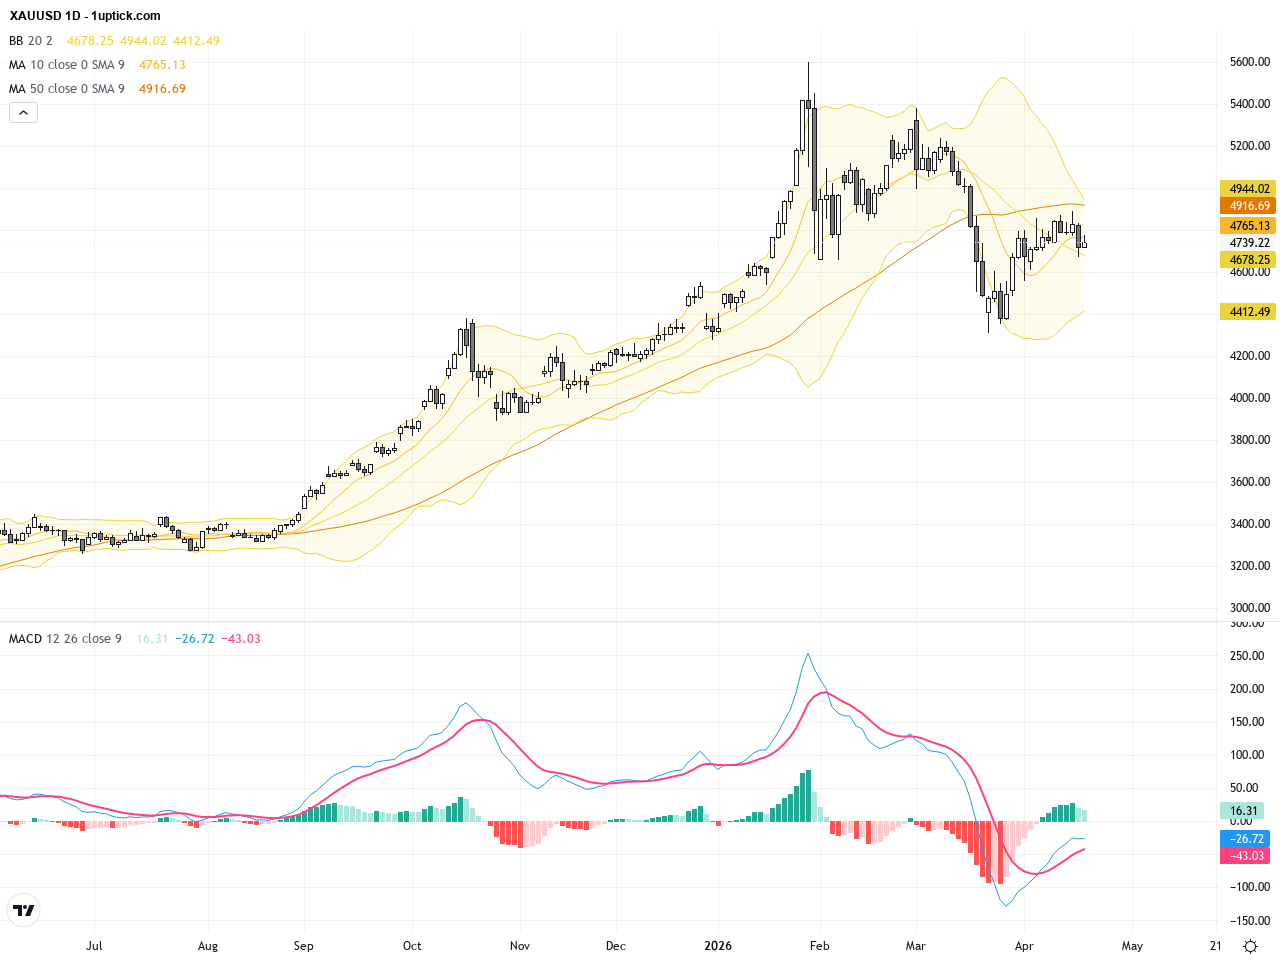
The daily chart illustrates that after a strong uptrend in mid-April, gold price encountered resistance around the 50-day moving average. The moving averages show a softening bullish momentum, Bollinger Bands are tightening indicating reduced volatility, and the MACD histogram is contracting, signaling weakening bullish momentum. The overall trend is consolidative with key moving averages and the Bollinger middle band acting as critical resistance and support.
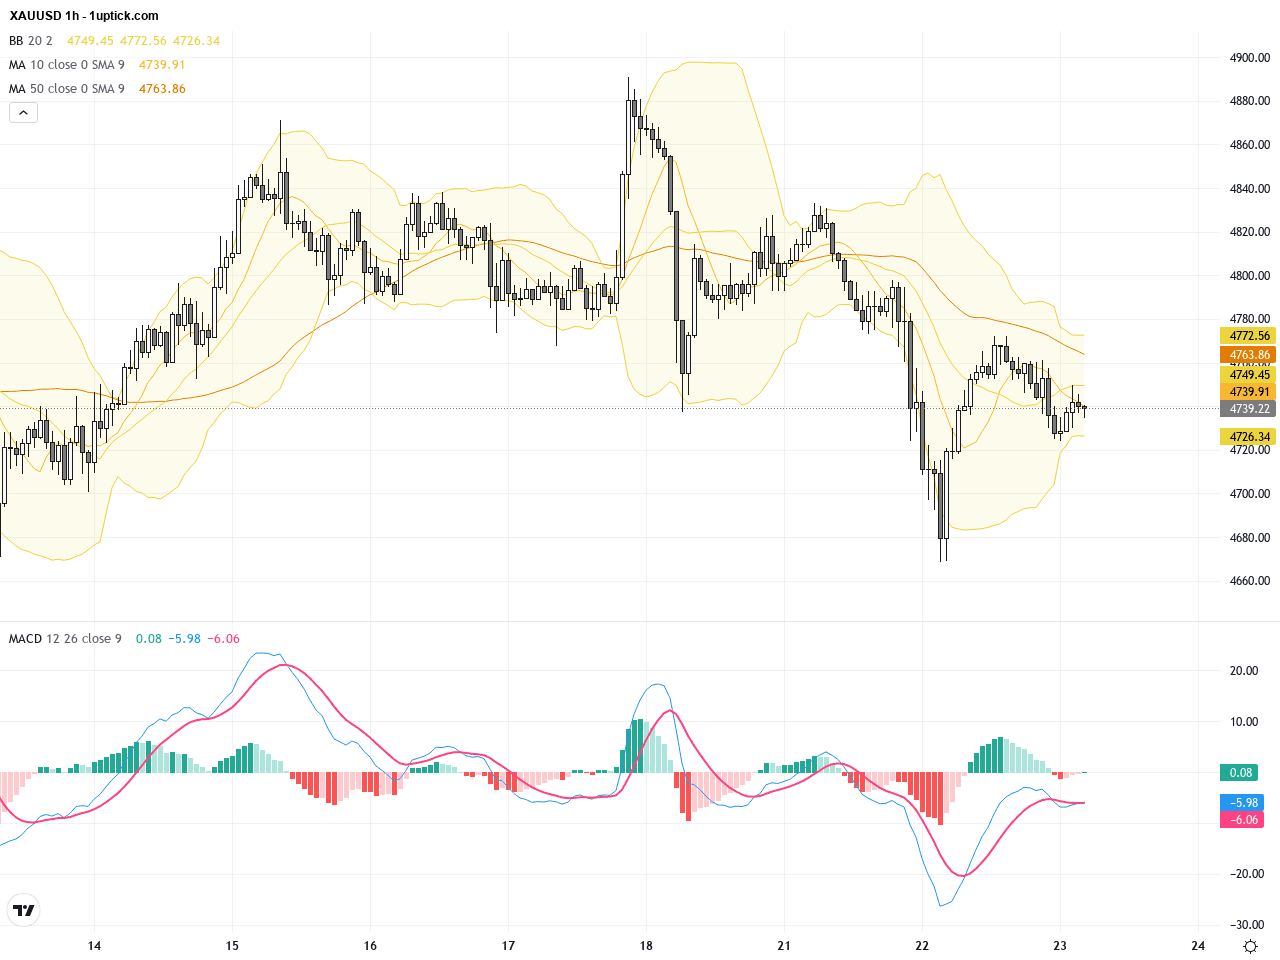
On the hourly chart, XAUUSD presents a short-term oscillation pattern over the past 3-5 days, failing to convincingly break above the 4745 resistance level twice. The MACD has formed a bullish crossover recently, but the RSI hovers near mid-level, suggesting equilibrium between buyers and sellers. A slight flag pattern is forming, implying price awaits a breakout in either direction. The latest candlestick is a hammer with a lower shadow, indicating potential short-term bullish support.
Technical Trend: The current trend is cautiously sideways, with balanced short-term forces. Market sentiment is swayed by the USD strength and geopolitical developments, as XAUUSD consolidates within a range awaiting directional cues.
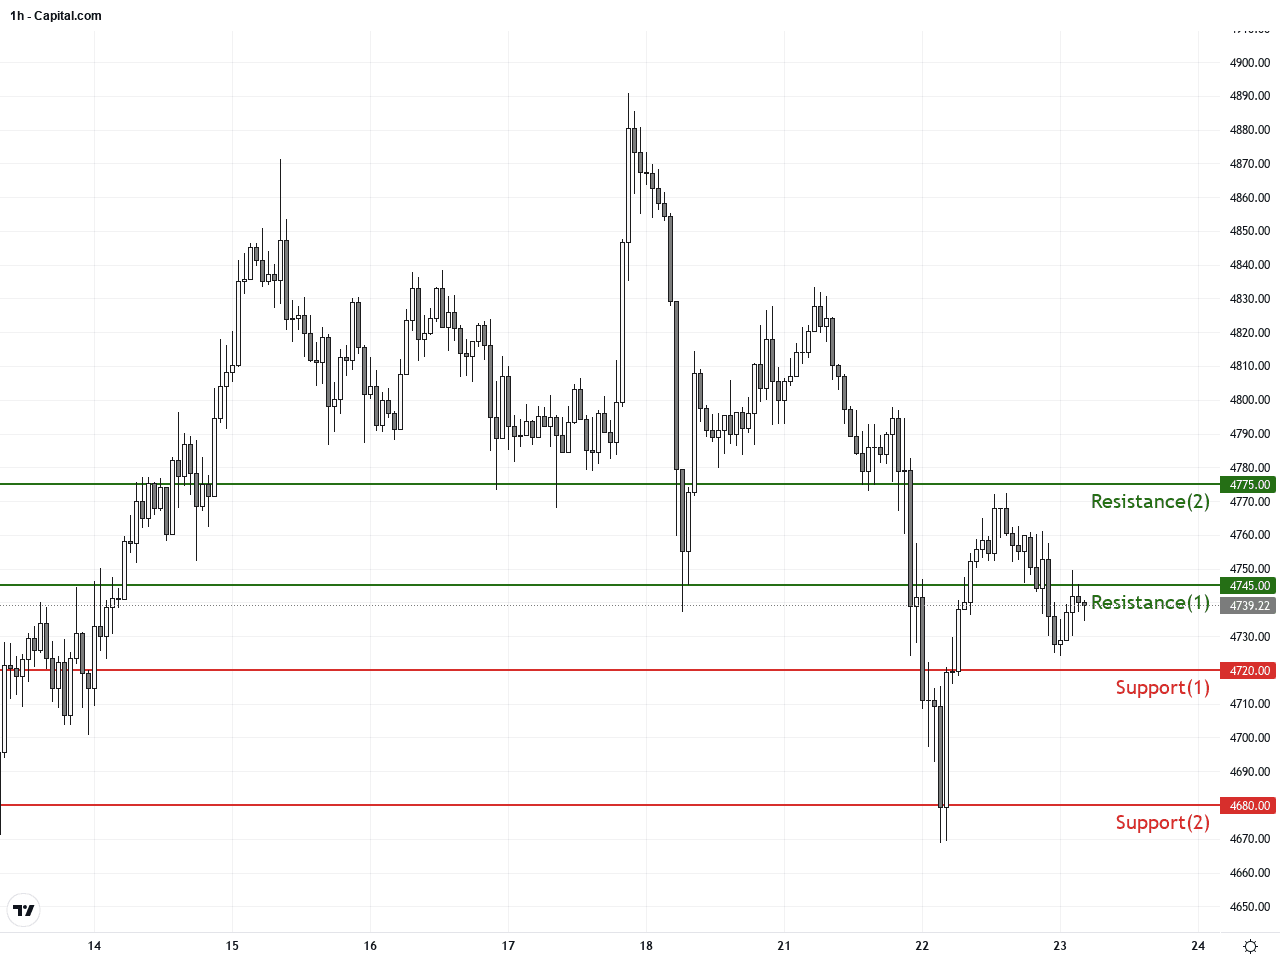
Technically, gold price is pressed against the resistance of the 50-day moving average, serving as a critical battleground between bulls and bears. The contracting MACD histogram and narrowing Bollinger Bands suggest consolidation, yet the hourly chart’s hammer candlestick indicates potential short-term stabilization. A decisive move above 4745 could open the door to retesting higher resistance levels. Conversely, breakdown below 4720 may trigger further downside. Traders should watch volume and breakout confirmations closely to capitalize on potential trade setups.Today’s economic calendar features data mainly from Japan and Europe. Japan’s March exports and imports exceeded expectations, signaling robust trade activities, likely supporting the yen but having limited direct impact on gold. UK’s March Consumer Price Index slightly matched forecasts, with little effect on global risk sentiment. No major US economic releases are scheduled, resulting in minimal direct data impact on XAUUSD. Thus, geopolitical events and USD movement remain the primary drivers today.
Resistance & Support
The above financial market data, quotes, charts, statistics, exchange rates, news, research, analysis, buy or sell ratings, financial education, and other information are for reference only. Before making any trades based on this information, you should consult independent professional advice to verify pricing data or obtain more detailed market information. 1uptick.com should not be regarded as soliciting any subscriber or visitor to execute any trade. You are solely responsible for all of your own trading decisions.