 |
| Gold V.1.3.1 signal Telegram Channel (English) |
GBPUSD: Sterling Holds Ground Amid USD Safe-Haven Demand with Key Technical Patterns Emerging, May 1, 2026
2026-05-01 @ 21:28
Over the past 24 to 48 hours, the GBP/USD pair remained relatively steady, hovering around 1.3610, close to yesterday’s closing price of 1.3597. The pound had initially surged nearly 1% following the Bank of England’s decision to hold interest rates steady, peaking at 1.3612. However, this upward momentum eased as safe-haven demand for the US dollar increased amidst rising tensions in Iran, dampening further gains for the pound.
This price action signals how inflation concerns and geopolitical risks have heightened demand for the US currency as a safe harbor. Investors adopted a cautious stance, awaiting forthcoming policy guidance from the Federal Reserve and the Bank of England. For everyday investors, this dynamic is akin to a scenario where a previously favored currency rally is checked suddenly by global uncertainties, highlighting how safety-first sentiment can swiftly influence forex market trends.

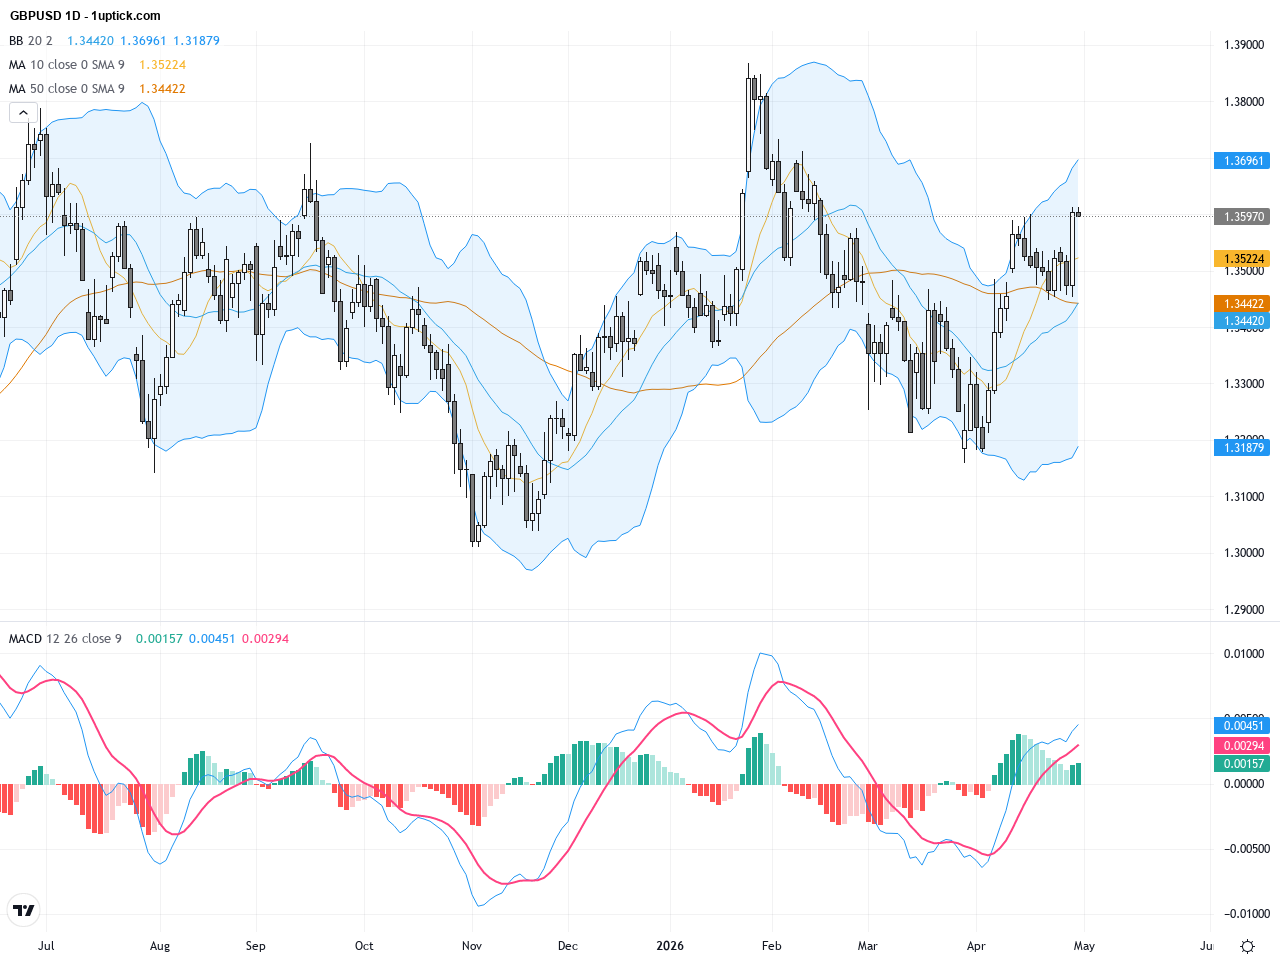
The daily chart reveals that GBPUSD has recently broken above its yearly average level (~1.3402) and remains comfortably above the 50-day moving average (1.3382), indicative of a sustained medium-term uptrend. Bollinger Bands are widening, signifying increased volatility, while the MACD histogram is expanding positively, underscoring strengthening bullish momentum. Since the late-April low around 1.3455, the price has steadily rallied but faces resistance near the 1.3600 to 1.3620 zone. Overall, the daily trend maintains a bullish bias, though consolidation near prior highs is currently apparent.
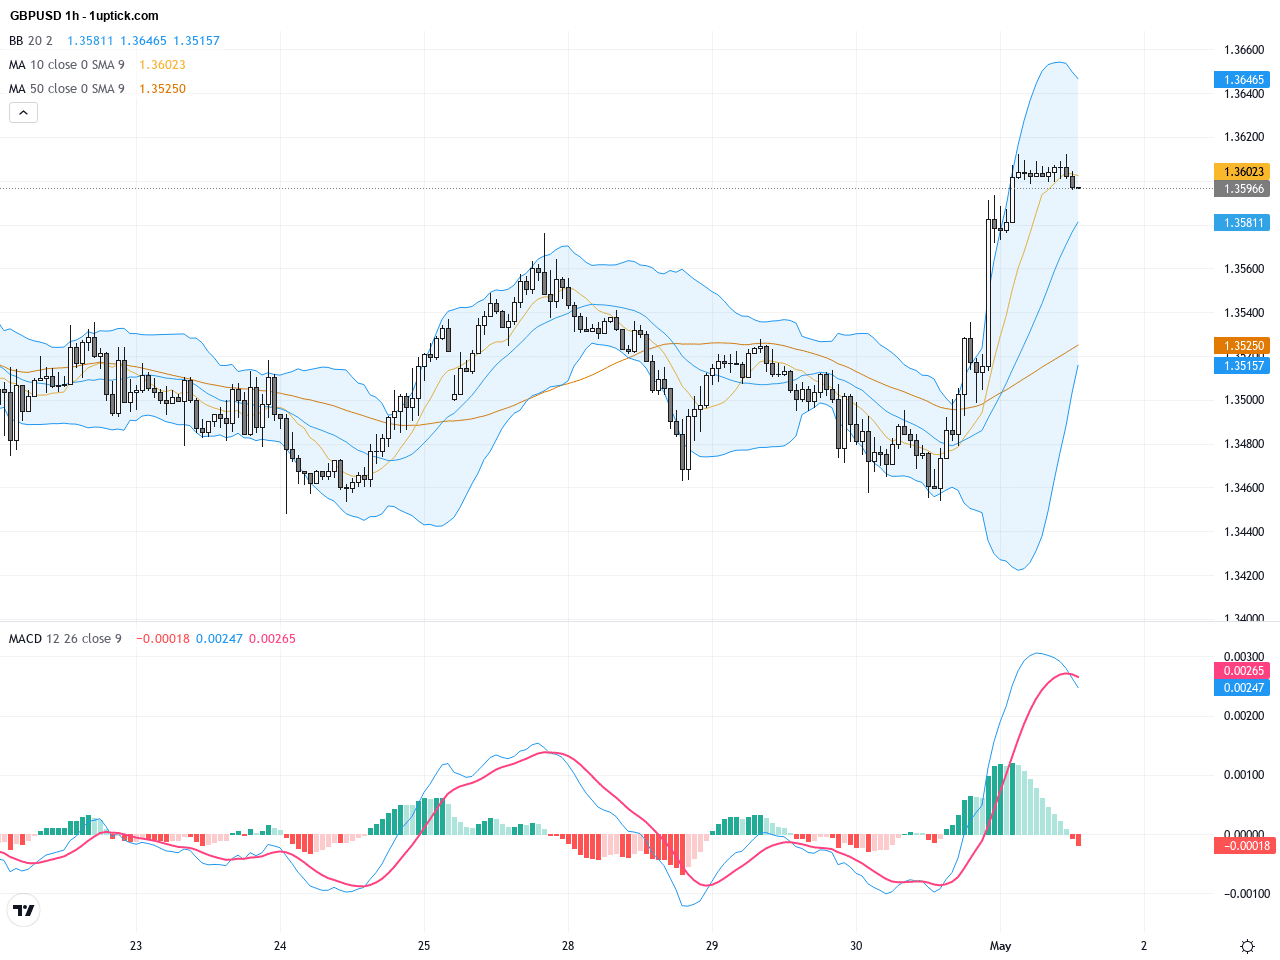
On the hourly chart spanning the past 3-5 days, GBPUSD exhibits an upward oscillating trend, with the 5-hour and 20-hour moving averages forming a golden cross signalling short-term bullish momentum. The price has tested and lifted off the middle Bollinger Band multiple times, indicating active buying interest. The MACD lines have crossed bullishly accompanied by rising volume. A recent bullish engulfing candlestick suggests possible attempts to test the 1.3620 resistance shortly, though traders should monitor support levels near 1.3550 in case of retracement.
Technical Trend: Current GBPUSD trend is cautiously bullish with a pattern of upward consolidation, suggesting moderate positive momentum.
Technically, GBPUSD’s recent strength breaking major moving averages and resistance levels confirms bullish accumulation. Daily Bollinger Bands expansion and an increasing MACD histogram indicate robust upward momentum, while the golden cross and bullish engulfing pattern on the hourly chart support near-term bullish continuation. It is crucial to watch how the pair handles the 1.3620 resistance zone; a decisive break could unleash further upside potential, whereas rejection might lead to a retest of key supports.Today’s economic calendar in GMT+1 features key UK data releases: April Nationwide House Prices, March Money Supply M4, Mortgage Approvals, and April Manufacturing PMI, scheduled between 08:00 and 10:30. These releases could mildly impact GBPUSD by providing insights into the UK’s housing market health, credit conditions, and manufacturing sector. However, the dominant market focus remains on geopolitical tensions and their effect on the USD, with no significant immediate event expected to dramatically shift GBPUSD trends today.
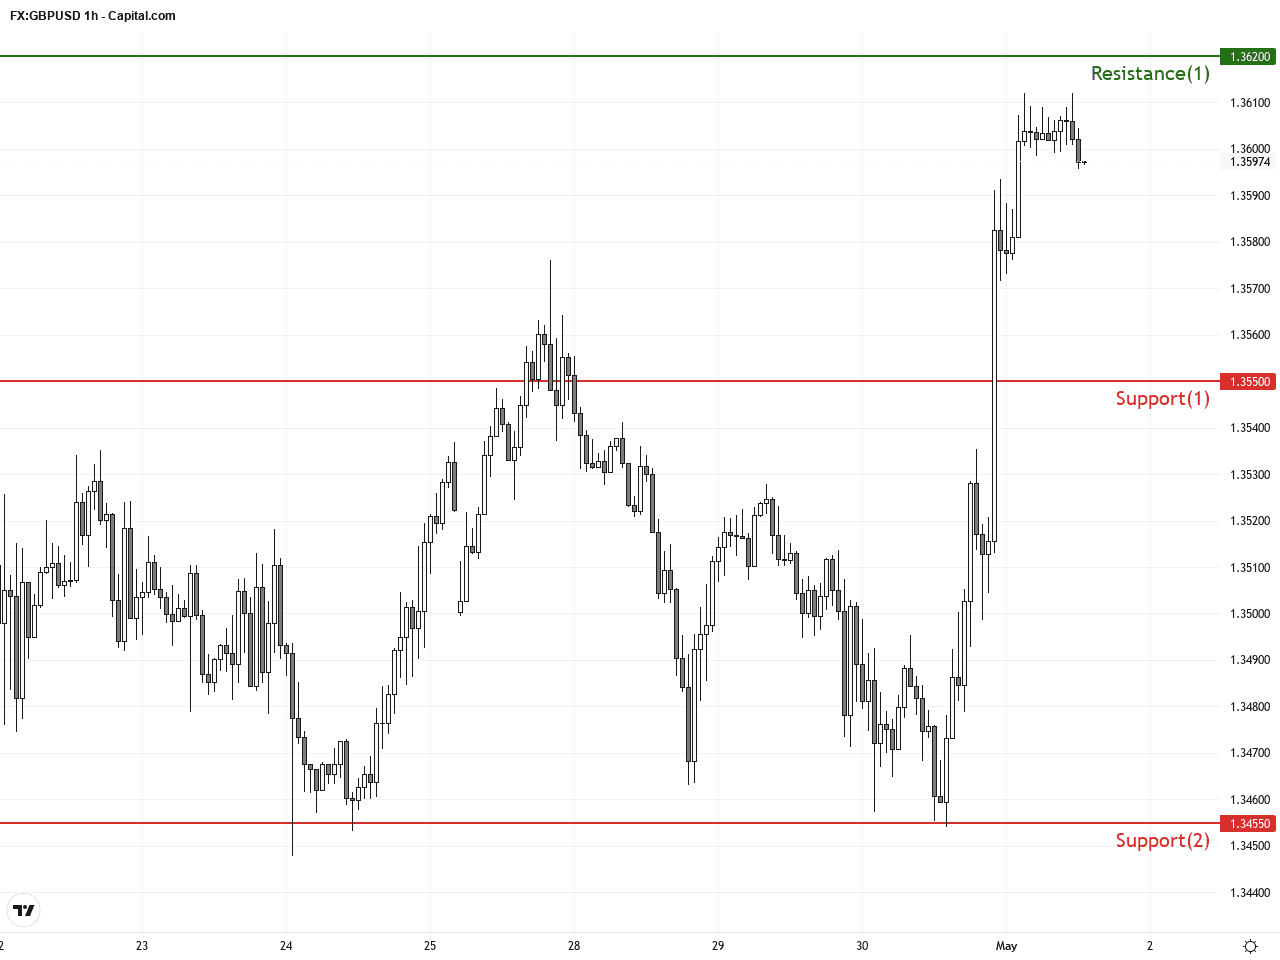
Resistance & Support
The above financial market data, quotes, charts, statistics, exchange rates, news, research, analysis, buy or sell ratings, financial education, and other information are for reference only. Before making any trades based on this information, you should consult independent professional advice to verify pricing data or obtain more detailed market information. 1uptick.com should not be regarded as soliciting any subscriber or visitor to execute any trade. You are solely responsible for all of your own trading decisions.