









 |
| Gold V.1.3.1 signal Telegram Channel (English) |
USDJPY Breaks 160 Level: Technical Patterns and Jobs Data Shape Trading Outlook, June 5, 2026
2026-06-05 @ 11:03
Over the past 24 to 48 hours, the USD/JPY currency pair has experienced notable volatility, closing yesterday around 159.976. The market’s attention has been laser-focused on the upcoming U.S. nonfarm payrolls report, which is widely anticipated to impact the dollar and, by extension, the dollar-yen exchange rate.
According to the latest market news, expectations of strong U.S. jobs data have acted as a bullish catalyst for the dollar against most Asian currencies, with the yen experiencing significant weakness. Increased investor confidence in the U.S. economy, combined with Federal Reserve rate outlook and ongoing geopolitical tensions in the Middle East, has pushed the dollar near a two-month high. This upward pressure has accelerated the depreciation of the yen amid forecasts that the Bank of Japan might hike rates, although not rapidly enough to support the yen strongly.
In layman’s terms, for the average investor, the recent strength in the dollar is mainly driven by the expected U.S. employment data and a flight to safety amid uncertain global political conditions. For those holding yen exposure, it might be time to reassess risk, as the dollar’s powerful rally is clearly reflected in recent exchange rate movements.
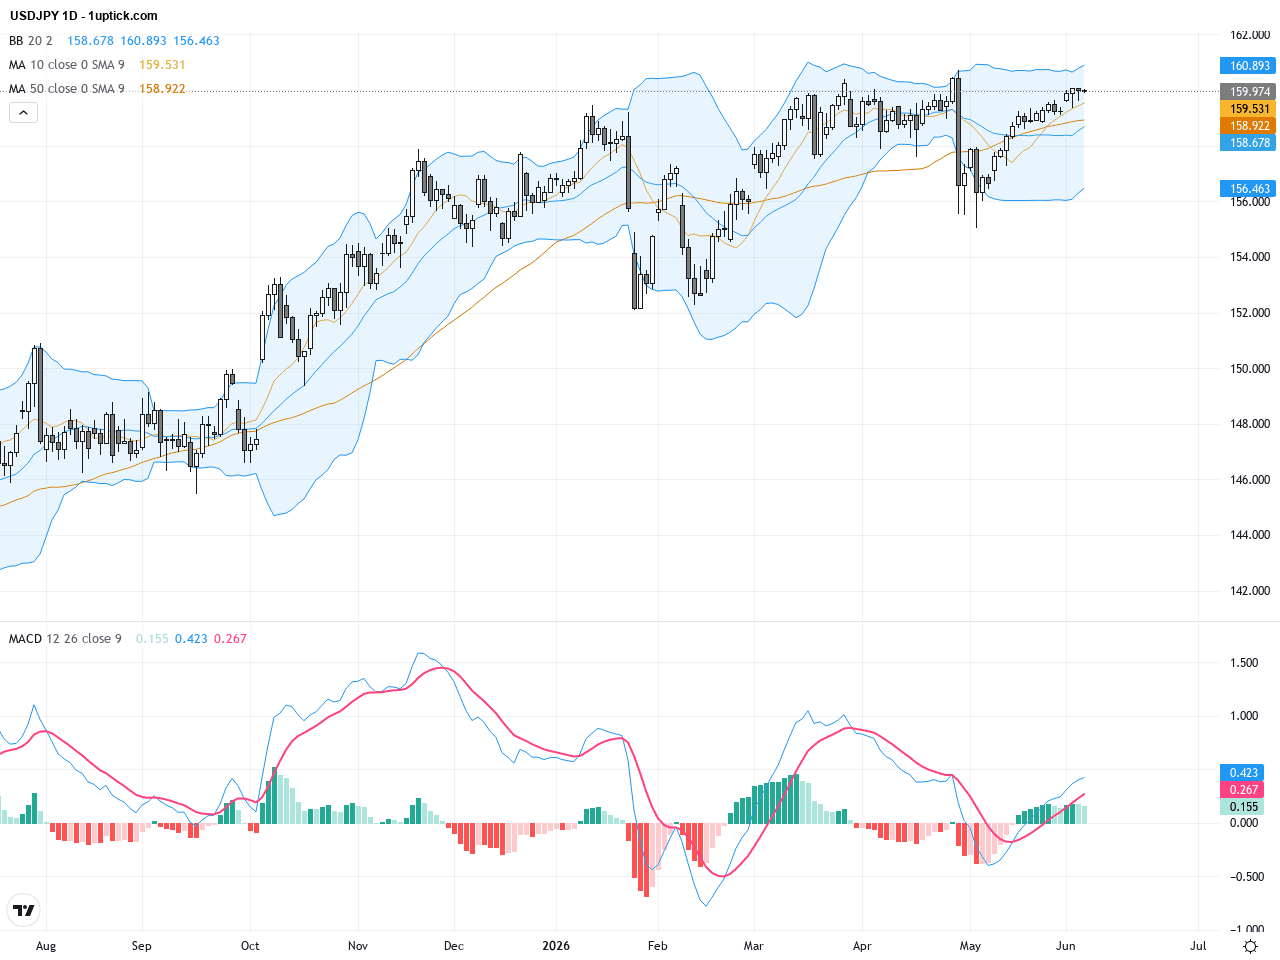
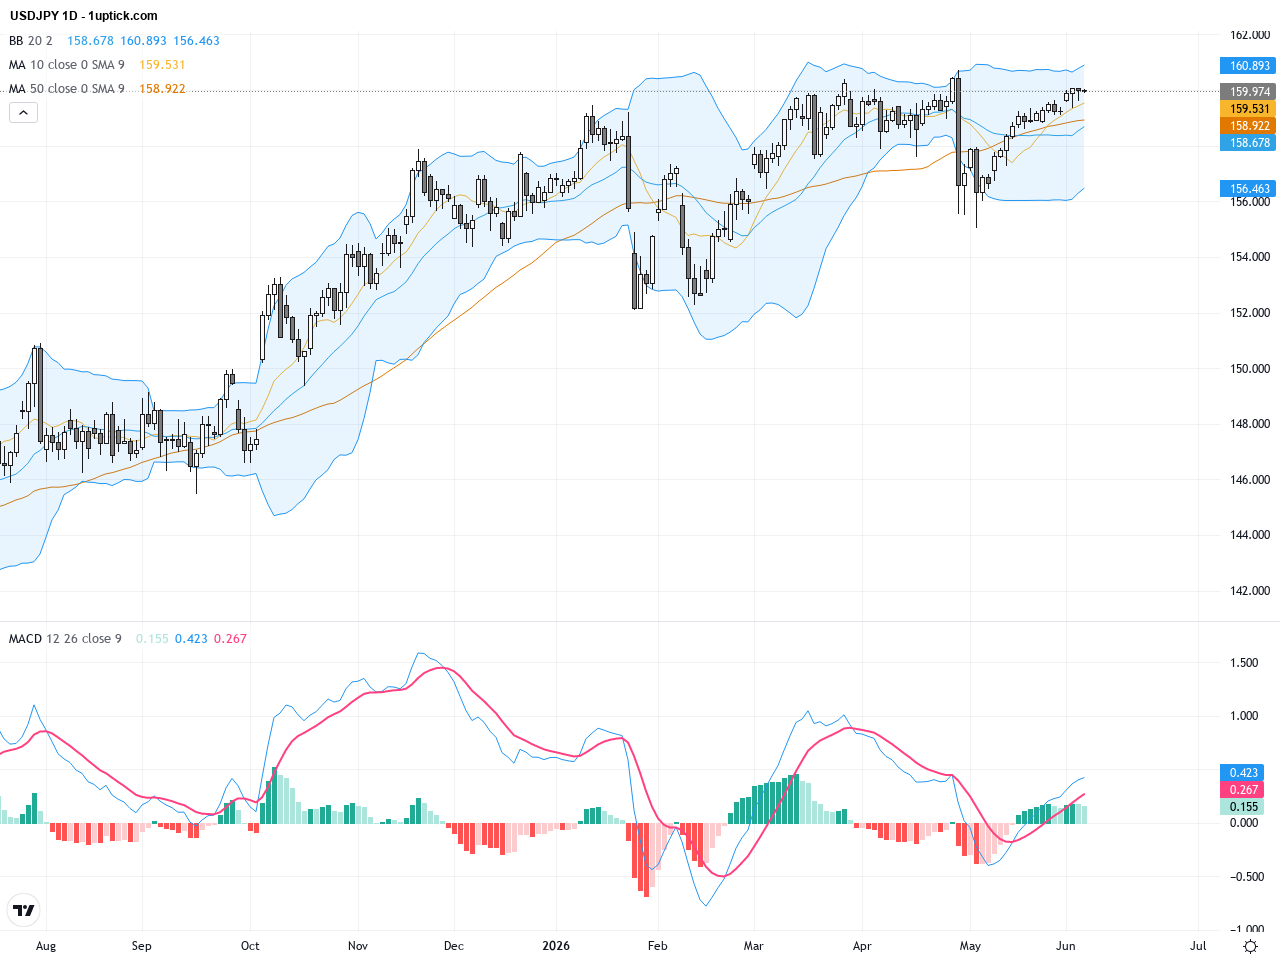
The daily chart shows USDJPY sustained an upward trend breaking above the critical 160 psychological barrier. The 50-day moving average (~158.85) and 200-day moving average (~155.20) provide strong support underneath. Bollinger Bands widen, indicating increased volatility and momentum. The MACD lines are diverging upwards, signaling bullish momentum continuation. The overall bias remains bullish on the daily timeframe, suggesting further upside potential if the price holds above 160.
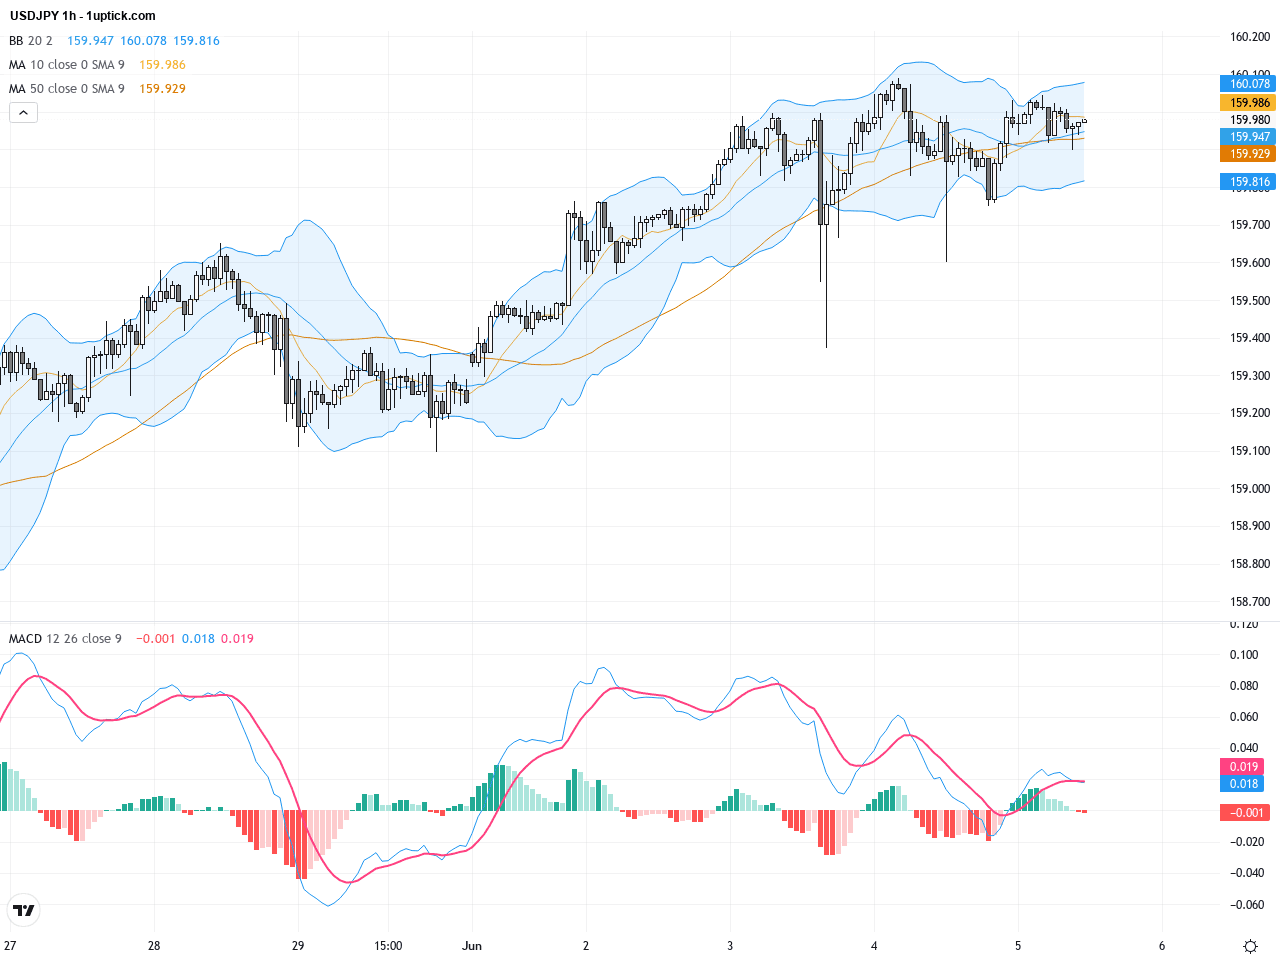
On the hourly chart, the pair has formed a steady upward trend over the past 3 to 5 days, climbing from around 159.5 to above 160. Short-term moving averages show a bullish golden cross with the 20-hour MA crossing above the 50-hour MA. The price recently touched the upper Bollinger Band and retracted slightly but remains above the middle band. MACD histogram bars are increasing with the signal line lagging, favoring bullish momentum. A notable recent bearish engulfing candle signals a possible short-term pullback, advising cautious entry.
Technical Trend: Trend Direction: Decisively Bullish with Consolidation Characteristics
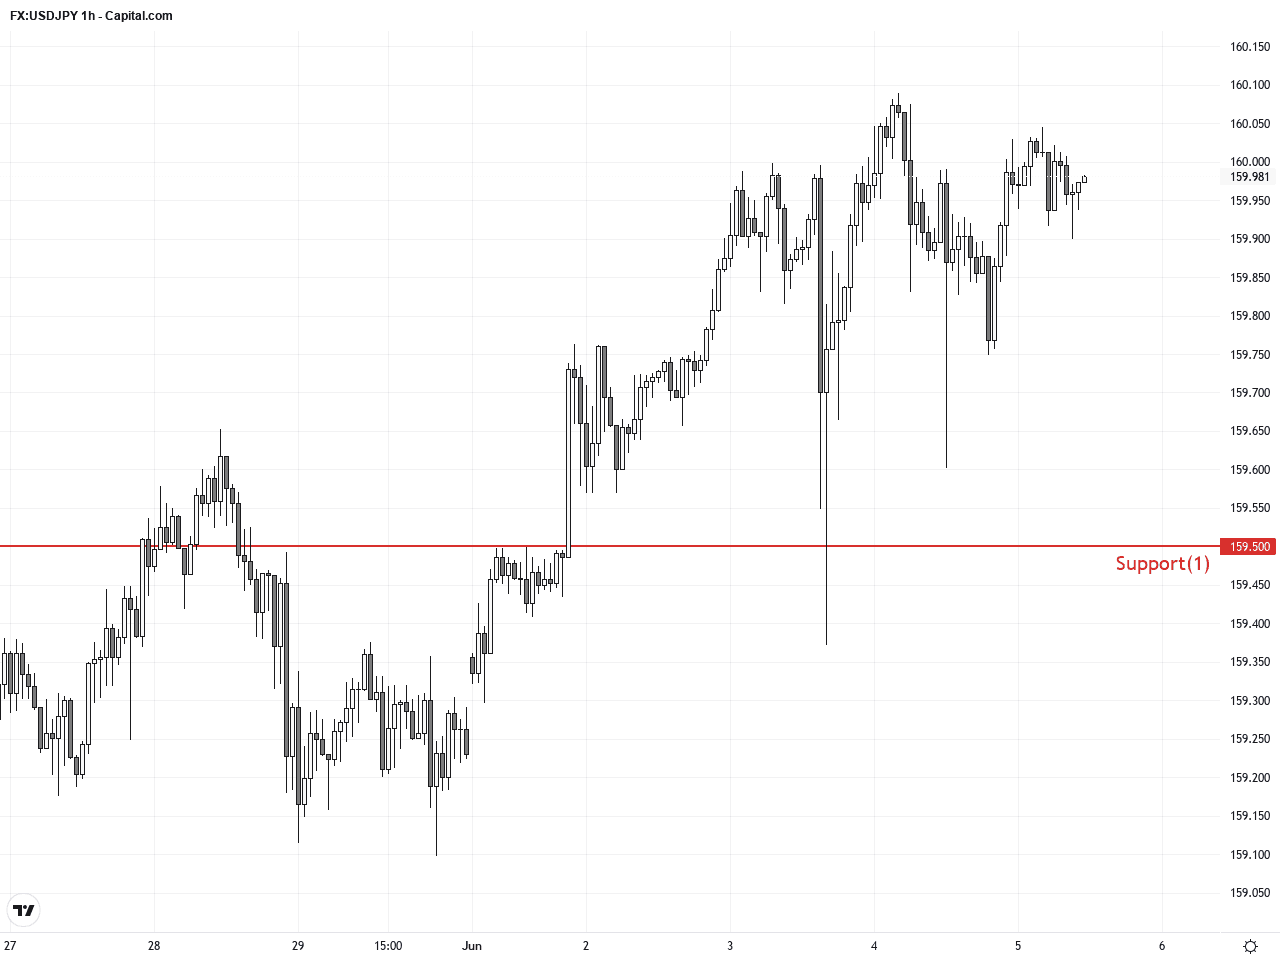
Technical analysis highlights a clear bullish momentum, supported by a MACD bullish crossover and expanding Bollinger Bands indicating persistent volatility. The recent hourly bearish engulfing candle flags a minor pullback risk and offers a defined risk point. Overall, the trend remains up with potential to continue higher if 160 support holds. The upcoming US employment data could act as a catalyst for increased volatility and directional moves, providing timely trading opportunities.Today’s economic calendar shows limited direct events impacting USDJPY. Key focus remains on forthcoming US data releases at 14:30 GMT+1, including Unit Labor Costs and Non-Farm Productivity. Stronger-than-expected US figures may bolster the dollar against the yen; weaker outcomes could ease dollar strength. No major Japanese economic data today means market moves primarily hinge on US releases. Traders should monitor the post-data market reaction closely to gauge USDJPY direction.
Resistance & Support
The above financial market data, quotes, charts, statistics, exchange rates, news, research, analysis, buy or sell ratings, financial education, and other information are for reference only. Before making any trades based on this information, you should consult independent professional advice to verify pricing data or obtain more detailed market information. 1uptick.com should not be regarded as soliciting any subscriber or visitor to execute any trade. You are solely responsible for all of your own trading decisions.