


 |
| Gold V.1.3.1 signal Telegram Channel (English) |
USDJPY: Struggles Near Intervention Zone Signal Cautious Trading Outlook with Key Technical Patterns, May 27, 2026
2026-05-27 @ 11:01
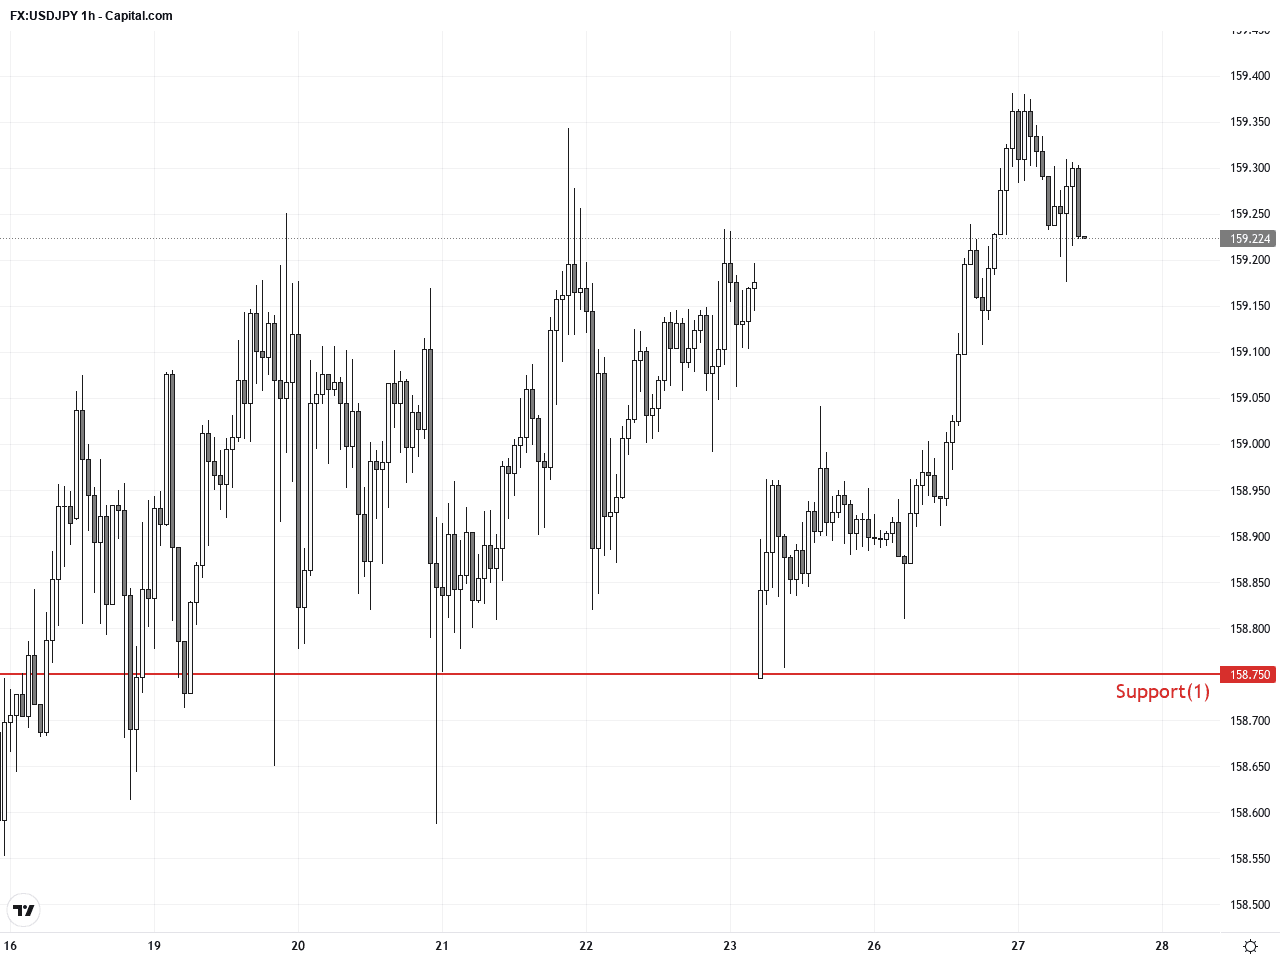
Over the past 24 to 48 hours, the USD/JPY pair has traded near the 159 level, closing yesterday at 159.224, slightly down by 0.035% from the previous day. Market attention remains sharply focused on the risk of intervention by Japan’s authorities to curb excessive yen weakening amid a broadly strong U.S. dollar.
The ongoing geopolitical tensions in the Middle East have bolstered the U.S. dollar, putting additional pressure on the yen and pushing USD/JPY above 159.3, reaching multi-year highs. However, fears of intervention by the Bank of Japan and Japanese government have capped further upside gains, with buyers hesitant as the pair approaches the psychologically significant 160 mark.
This scenario can be likened to a race where the driver (the dollar) is hitting top speeds, but a traffic officer (the BOJ) might step in at the next junction (159-160 zone) to control the pace. Investors should stay alert to policy moves and geopolitical developments, adjusting risk exposure accordingly in this environment of potential market intervention and volatility.

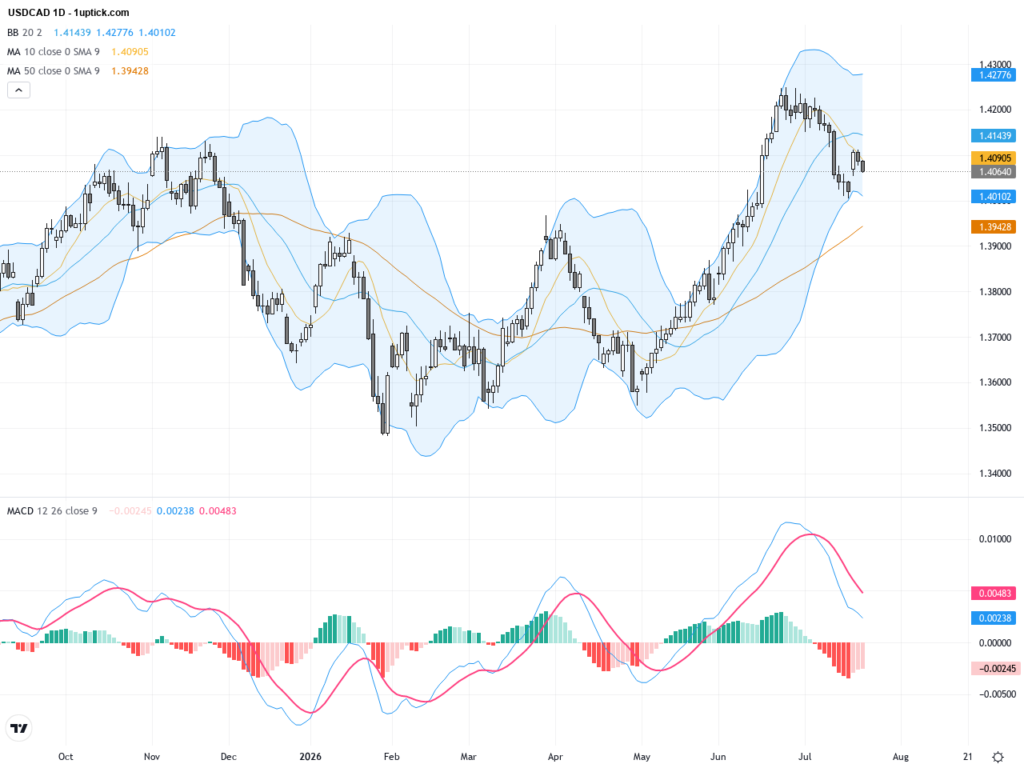
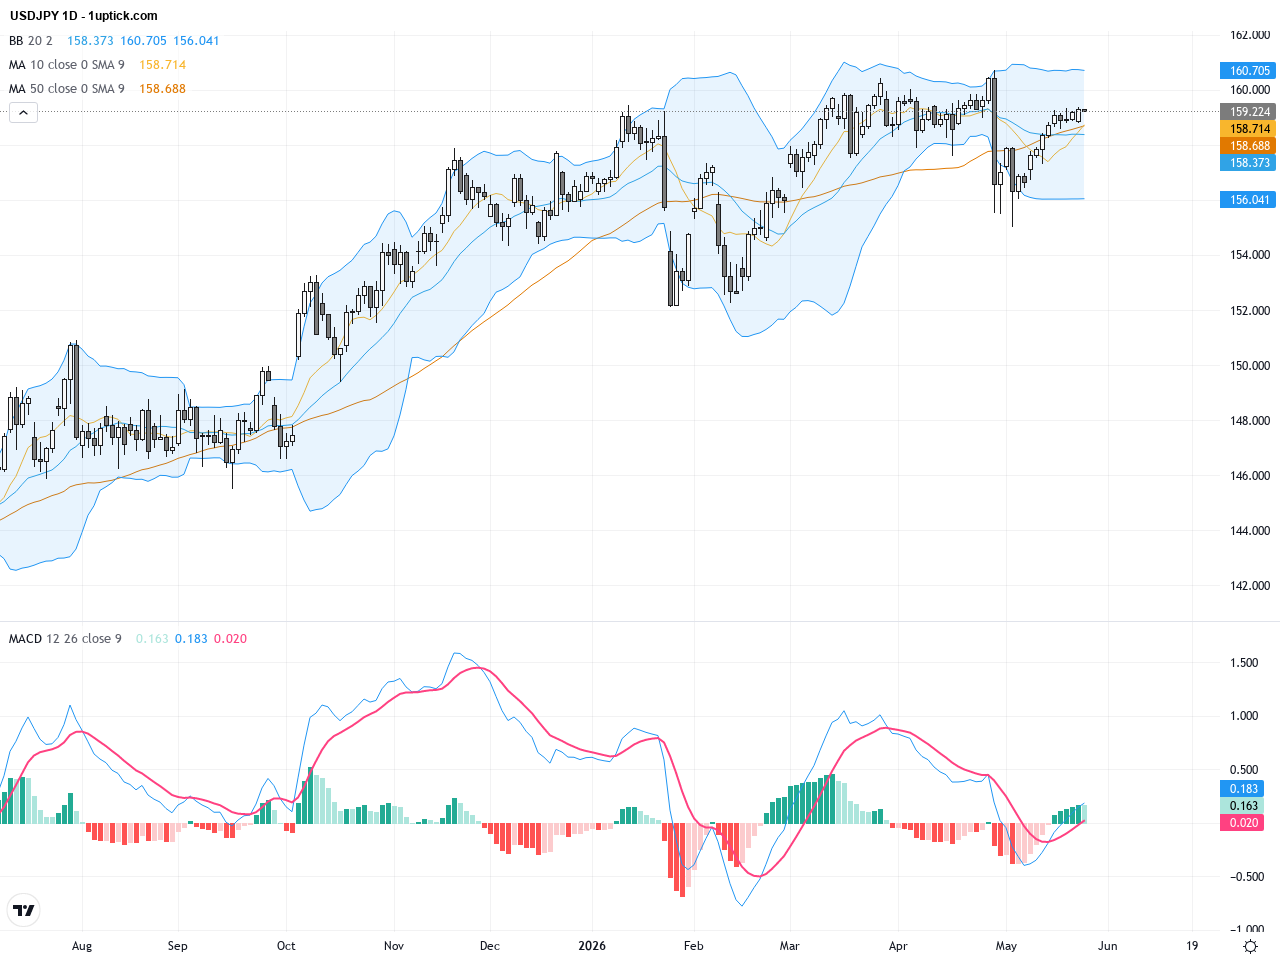
The daily chart displays a sustained uptrend in USDJPY since the beginning of the year, with the price consistently hitting new multi-month highs. The pair trades above both the 50-day and 200-day moving averages, confirming strong medium- to long-term bullish momentum. Bollinger Bands are contracting, indicating lower volatility, while the MACD shows bullish alignment. However, trading near elevated levels suggests caution for potential pullbacks.
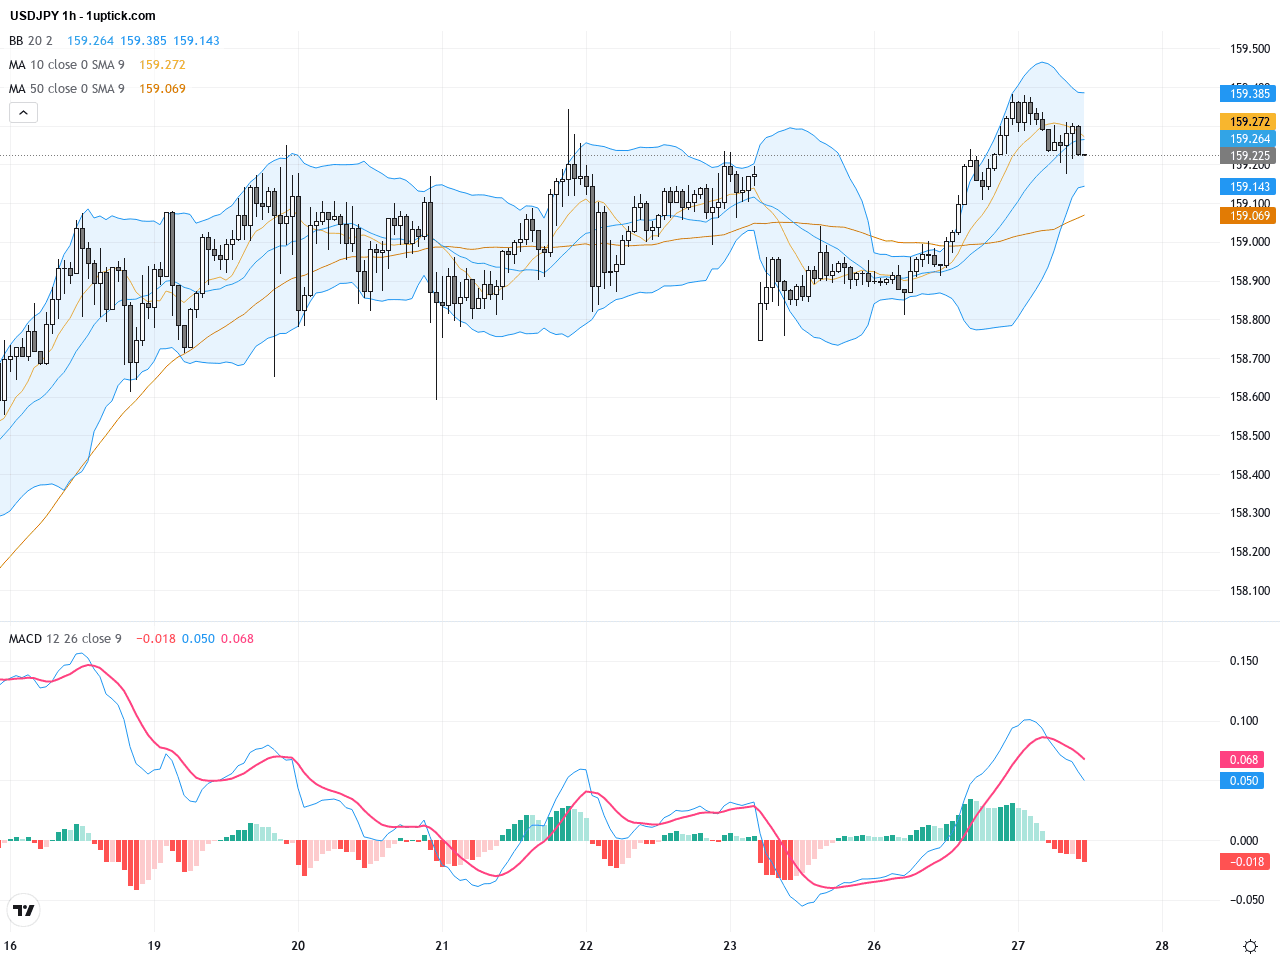
Hourly chart analysis over the past 3-5 days shows the USDJPY consolidating, with prices oscillating around the middle Bollinger Band. Moving averages are converging, signaling indecision. The MACD histogram is shrinking, hinting at waning momentum, and RSI is retreating from overbought territories—both suggesting a short-term cooling off. Recent candlesticks form a small doji, reflecting market indecisiveness and signaling potential sideways movement in the next 24 hours.
Technical Trend: USDJPY is currently in a cautiously bullish consolidation phase, with increased volatility potential from policy-driven market swings.
Technically, USDJPY remains in a medium-term uptrend on the daily chart, but the hourly timeframe flags waning bullish momentum. MACD bearish divergence and stalled price action near resistance at 160 level hint at a possible near-term pullback. The market’s sensitivity to potential Japanese intervention adds further uncertainty. Traders should watch for confirmation signals before committing to new positions and maintain prudent risk management around this key price zone.Today’s key event for USDJPY is the speech by Bank of Japan Governor Ueda at 08:00 GMT+1 (16:00 HKT). This event is critical as any hints about monetary policy stance or intervention measures can sway the yen sharply. Later US FOMC members also speak but with less immediate expected impact on USDJPY. No major economic data releases are scheduled, so traders should focus on these policy remarks for directional cues.
Resistance & Support
The above financial market data, quotes, charts, statistics, exchange rates, news, research, analysis, buy or sell ratings, financial education, and other information are for reference only. Before making any trades based on this information, you should consult independent professional advice to verify pricing data or obtain more detailed market information. 1uptick.com should not be regarded as soliciting any subscriber or visitor to execute any trade. You are solely responsible for all of your own trading decisions.