


 |
| Gold V.1.3.1 signal Telegram Channel (English) |
AUDUSD Technical & Fundamental Analysis: Middle East Peace Talks Ignite Rebound Above 0.7150, May 27, 2026
2026-05-27 @ 06:01
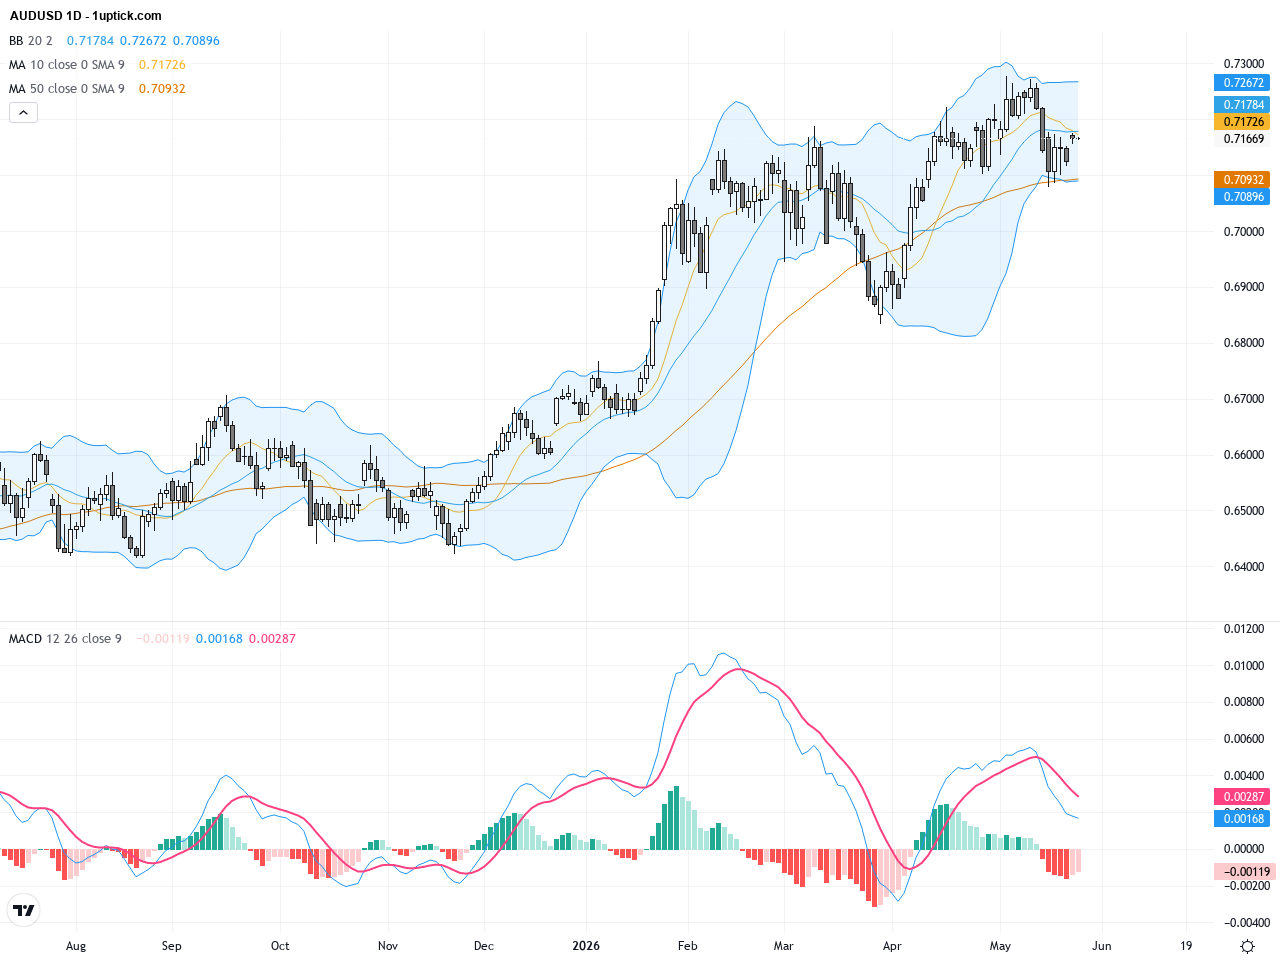
Over the past 24 to 48 hours, the AUD/USD currency pair rebounded, driven by soft Australian employment data and renewed hopes for a Middle East peace deal. The price moved up from yesterday’s close of approximately 0.71659 to a high near 0.7176. The recent weakness in Australian jobs figures tempered expectations for nearer-term RBA rate hikes, while broader US rate outlook and a weaker dollar provided additional support to the Aussie. Although volatility was moderate, the price action mirrored investors’ cautious optimism amidst evolving geopolitical developments and mixed economic signals.
For an average investor, it’s like worrying about a company’s performance after disappointing reports, but then receiving news that a long-standing dispute is resolved, which boosts confidence in future prospects. Similarly, AUD initially weighed down by economic softness regained momentum on hopes for peace progress in the Middle East, illustrating how market sentiment can shift on multiple fronts simultaneously.
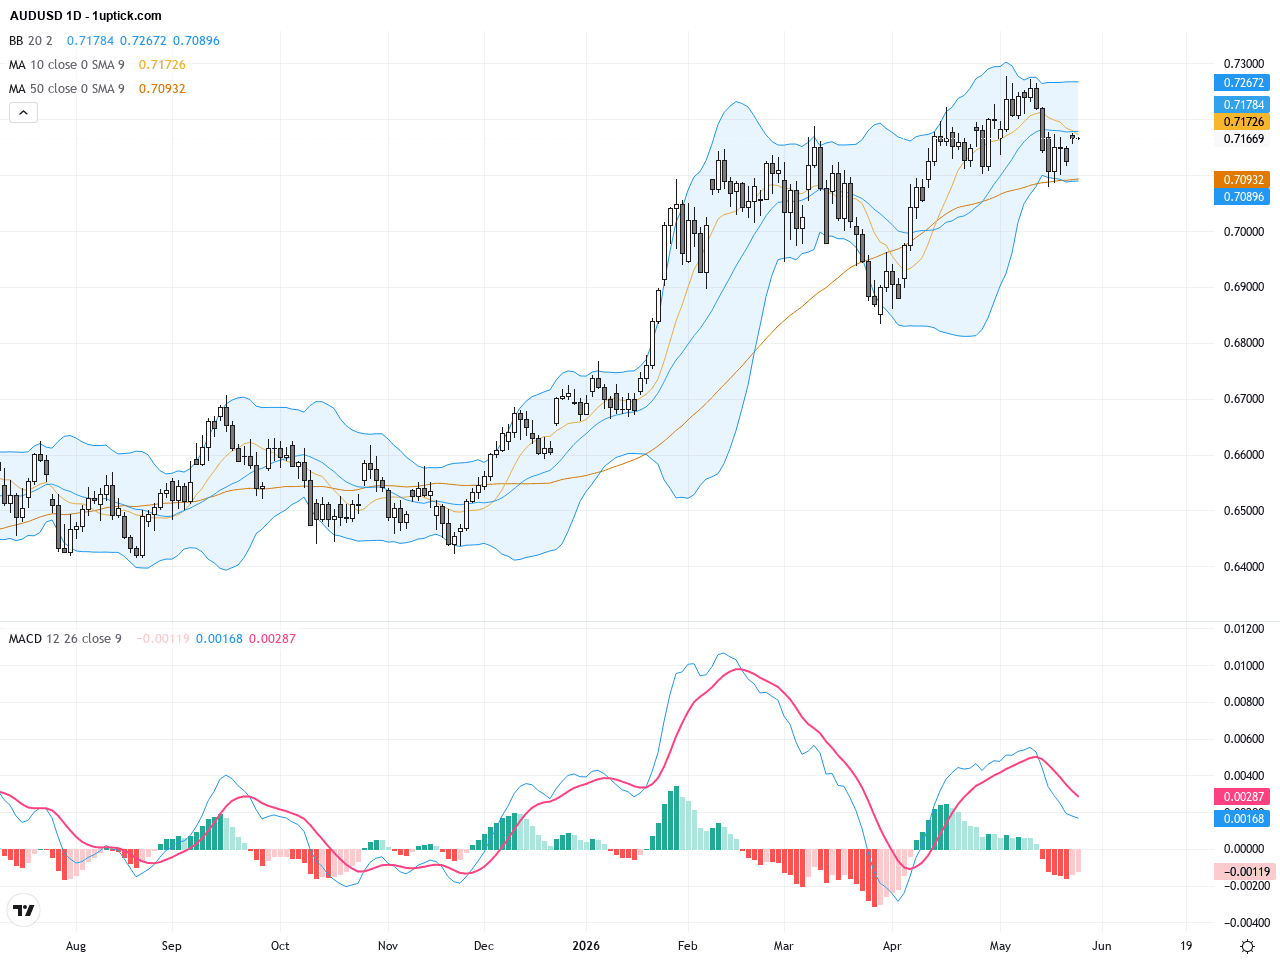
The daily chart reveals a consolidative range for AUDUSD, with prices oscillating between 0.7100 and 0.7200. The 50-day moving average stands near 0.71137, providing immediate support, while the 200-day MA at 0.68438 offers a longer-term safety net. Bollinger Bands have narrowed, indicating moderate volatility, and the MACD signals a mild bullish momentum. This setup suggests a potential for the pair to attempt a breakout above the rectangle pattern’s upper boundary if support holds.
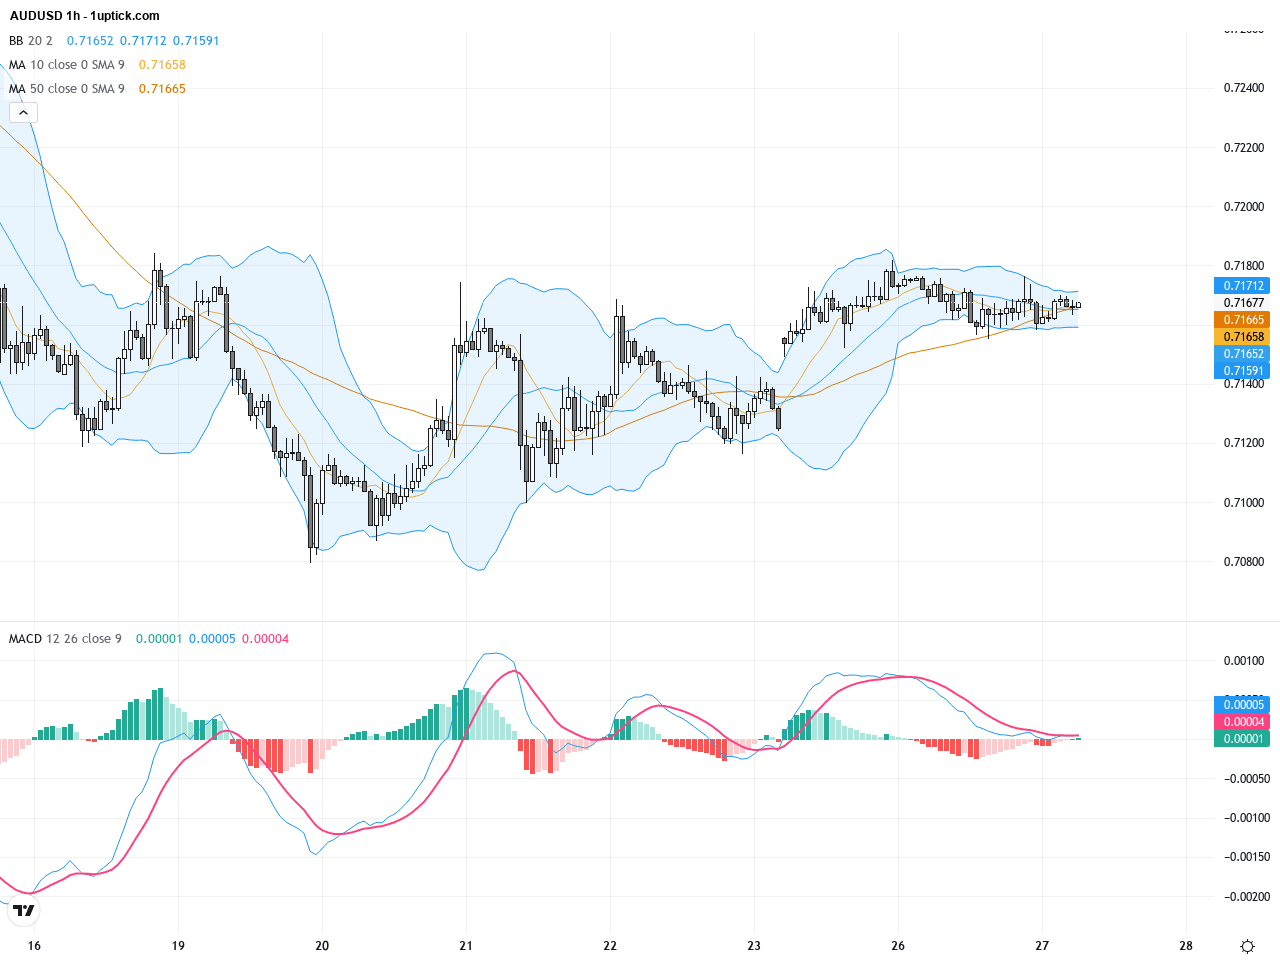
On the hourly chart covering the last 3-5 days, AUDUSD has formed a clear uptrend from the 0.7100 low to close to 0.717. The 9-day EMA acts as dynamic support, and the MACD has recently crossed bullishly, accompanied by RSI staying above midpoint levels, reinforcing upward momentum. The expanding Bollinger Bands hint at a possible near-term breakout; however, losing 0.7130 support could trigger a pullback.
Technical Trend: Cautiously bullish with moderating retracements and strengthening upside momentum.
Technically, AUDUSD is forming a rectangle consolidation pattern on the daily chart, currently supported above the 50-day MA, signaling ongoing bullish sentiment. A recently emerging inverse head and shoulders pattern suggests a constructive reversal with upside potential. The daily engulfing candlestick pattern confirms initial bullish momentum. A decisive break above 0.7180 resistance would validate bullish continuation. In the short-term hourly timeframe, the MACD golden cross and the expanding Bollinger Bands provide additional buy signals. Waiting for a clear breakout before entering would maximize trade probability.Today’s economic calendar highlights the Australian Consumer Price Index (CPI) release at 03:30 GMT+1 as the most directly relevant event for AUDUSD. The CPI forecast is slightly lower at 4.4% y/y compared to the previous 4.6%, which may temper RBA tightening expectations and influence AUD price direction. Additionally, Bank of Japan chairman speeches and New Zealand’s monetary policy updates warrant attention but are expected to have a lesser impact. Traders should monitor the CPI data closely as it may cause short-term volatility in AUDUSD.
Resistance & Support

The above financial market data, quotes, charts, statistics, exchange rates, news, research, analysis, buy or sell ratings, financial education, and other information are for reference only. Before making any trades based on this information, you should consult independent professional advice to verify pricing data or obtain more detailed market information. 1uptick.com should not be regarded as soliciting any subscriber or visitor to execute any trade. You are solely responsible for all of your own trading decisions.