


 |
| Gold V.1.3.1 signal Telegram Channel (English) |
WTI Crude Oil: Watch Key Resistance Amid Iran Geopolitical Risks Driving Volatility, May 14, 2026
2026-05-14 @ 06:03
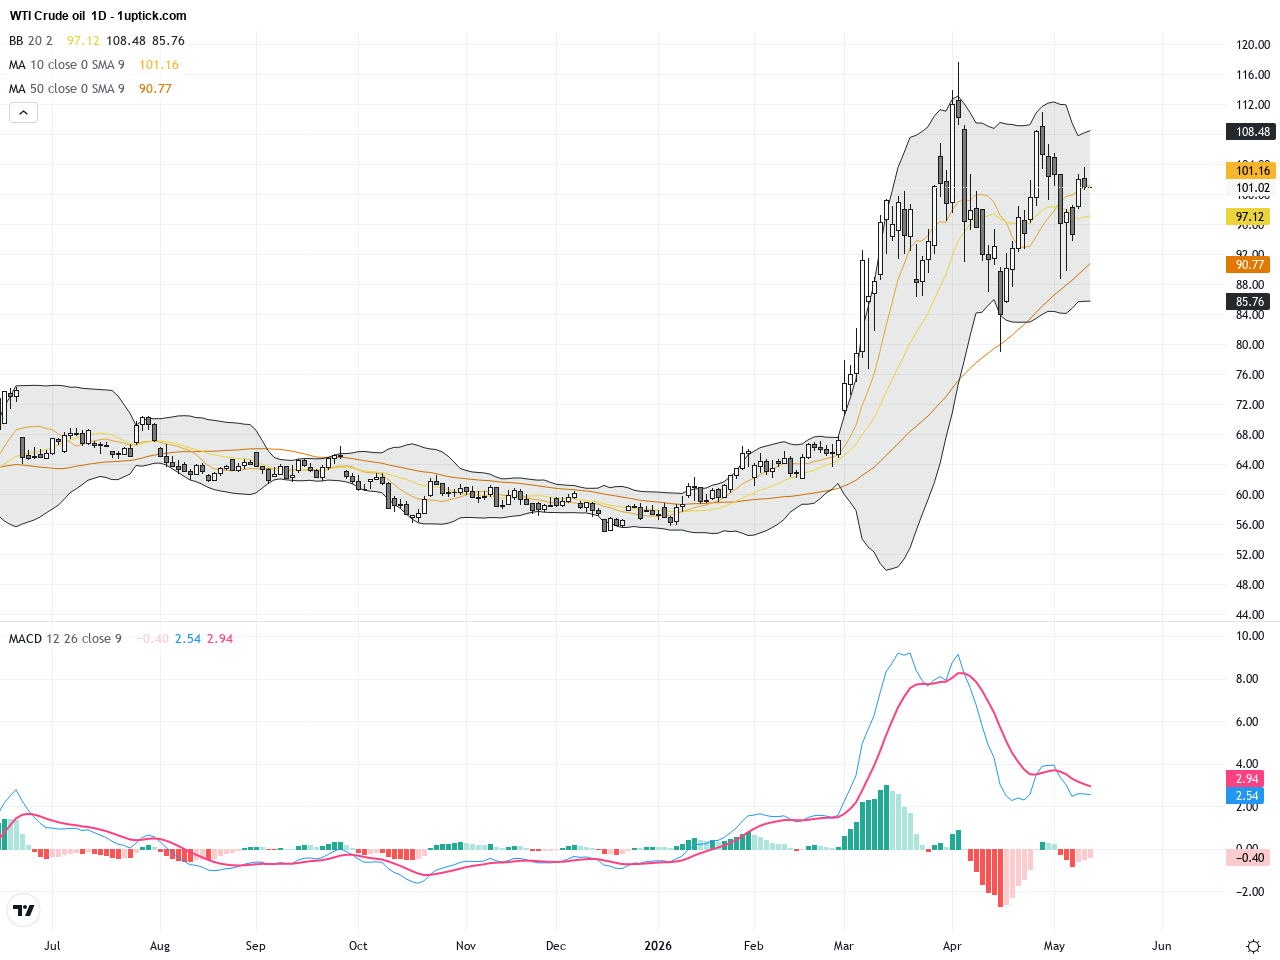
Over the past 24 to 48 hours, WTI crude oil prices showed noticeable volatility but maintained a generally stable trend. The closing price on May 13, 2026, was $101.02 per barrel, slightly down from the previous day, reflecting cautious investor sentiment amid concerns about energy supply risks and geopolitical tensions.
Recent market news highlights former U.S. President Trump’s trip to China, bringing renewed focus on geopolitical tensions surrounding Iranian oil exports. Notably, Iran’s main oil terminal went dark unexpectedly, fueling fears of potential supply disruptions. This raised the risk premium in crude markets, leading to intermittent price surges and heightened price fluctuations as traders reacted to the uncertain supply outlook.
For the average investor, this scenario can be likened to a family suddenly facing instability in their reliable fuel supply. The inability to confidently predict oil availability causes market participants to act more nervously, leading to choppy price movements. Staying informed with the latest market news and adjusting investment strategies based on evolving supply-demand dynamics are crucial in such a volatile environment.

The daily chart of WTI Crude Oil shows a price retracement from recent highs near $107, now consolidating between $100 and $103. The Bollinger Bands are contracting, indicating reduced volatility, while the 20-day and 50-day moving averages are converging, forming a critical area that may signal a trend change. The daily MACD remains in an uptrend but with waning momentum, suggesting short-term bullish strength is fading but not reversing yet. Overall, the daily trend is in a consolidation phase, awaiting a decisive breakout above or below the Bollinger Bands.

On the hourly chart covering the past 3-5 days, WTI Crude Oil has established a clear stair-step uptrend, breaking through several minor resistance levels. Short-term moving averages (9 and 21 EMA) are trending upwards, and the MACD is approaching a bullish crossover, signaling building buying momentum. Bollinger Bands are expanding, reflecting increased short-term volatility. The recent key candlestick pattern is an inverted hammer with a long upper wick, indicating selling pressure overhead and the potential for a near-term pullback or sideways shakeout.
Technical Trend: WTI Crude Oil is presently in a ‘Cautiously Consolidating’ trend, displaying heightened short-term volatility without a definitive directional bias, awaiting a breakout signal.
From a technical standpoint, WTI Crude Oil is currently range-bound within a well-defined consolidation zone. The convergence of moving averages and narrowing Bollinger Bands on the daily chart suggest a pending breakout. A close above the upper Bollinger Band coupled with a MACD bullish crossover could set the stage for a new upward leg. Conversely, failure to hold key support areas might trigger a sharper correction. On the hourly chart, the inverted hammer candle warns of potential short-term retracement, emphasizing the need to watch volume and momentum indicators for confirmation.There are no significant or directly relevant economic events scheduled today that are expected to impact WTI Crude Oil prices. Price action will likely continue to be driven by geopolitical developments and inventory data releases.
Resistance & Support

The above financial market data, quotes, charts, statistics, exchange rates, news, research, analysis, buy or sell ratings, financial education, and other information are for reference only. Before making any trades based on this information, you should consult independent professional advice to verify pricing data or obtain more detailed market information. 1uptick.com should not be regarded as soliciting any subscriber or visitor to execute any trade. You are solely responsible for all of your own trading decisions.