


 |
| Gold V.1.3.1 signal Telegram Channel (English) |
EURUSD: Oil Price Surge Fuels Inflation Concerns, Watch 1.1700 Key Support, May 13, 2026
2026-05-13 @ 09:01
Over the past 24 to 48 hours, the EUR/USD market experienced mild volatility. The pair closed yesterday around 1.1738 USD, a slight decline of approximately 0.02% from the previous day. This movement was largely driven by a renewed surge in oil prices amid stalled US-Iran negotiations, which exerted pressure on energy-importing currencies including the euro.
Latest market news highlights that heightened US-Iran tensions boosted crude oil prices, impacting currencies such as the euro. Additionally, forecasts anticipate the US April Consumer Price Index (CPI) to rise to 3.7%, the highest since September 2023, fueling inflation expectations for the dollar. Although the dollar softened briefly due to a record drop in US consumer sentiment, euro remains cautious amid geopolitical uncertainty and the energy price squeeze.
For the average investor, this translates to recent EUR/USD fluctuations being mainly influenced by global oil price dynamics and US-Iran conflict developments. As rising energy costs typically weigh on euro and other energy-importing currencies by increasing import-driven inflation inside the Eurozone, this poses economic headwinds. Investors should keep a close watch on US-Iran diplomacy and oil price movements as these factors will continue to shape the euro’s near-term direction.

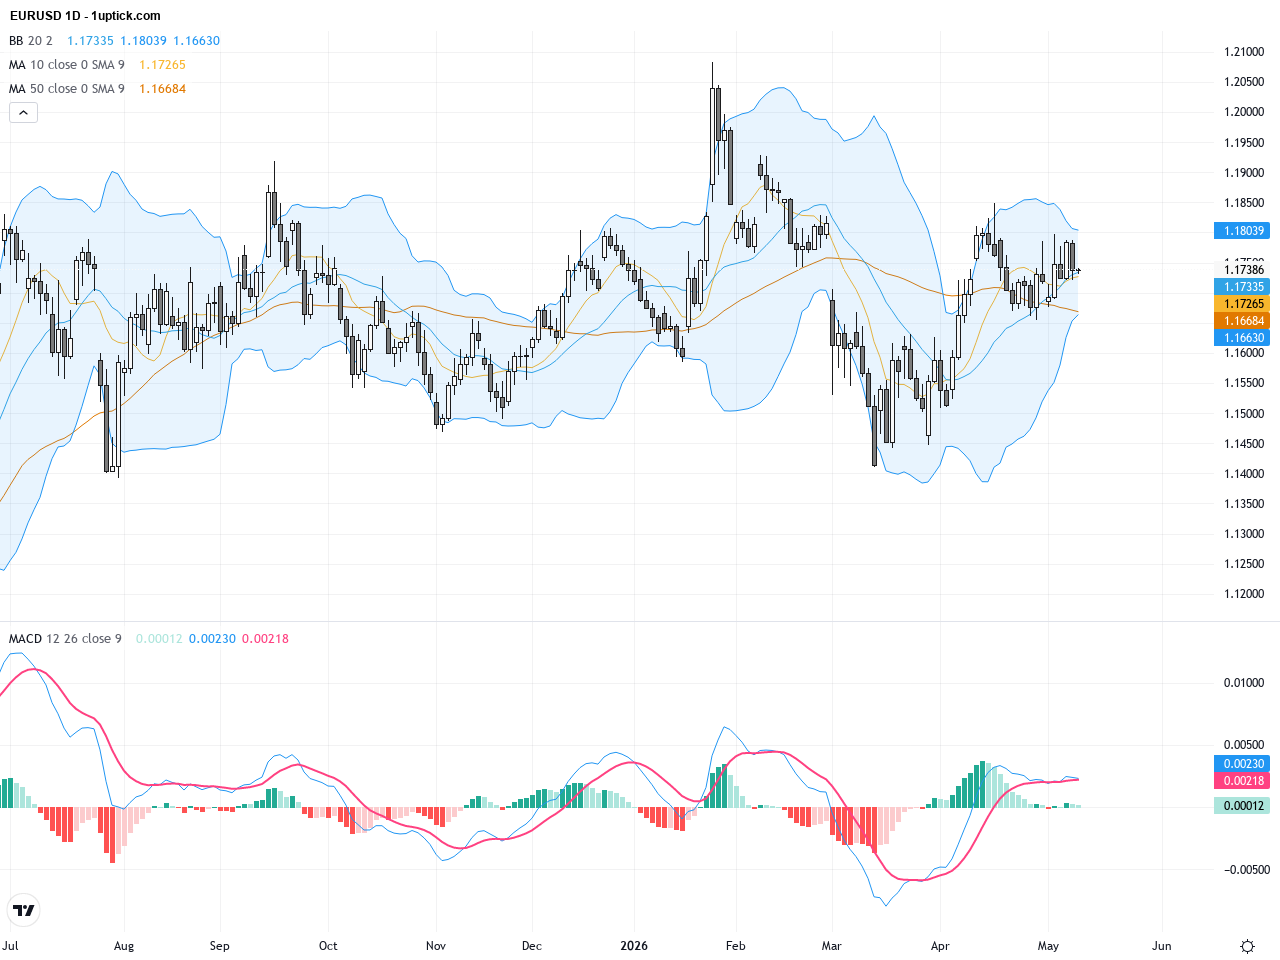
The daily chart shows EURUSD trending moderately upwards since the start of the year but recently stalling around the 1.1750-1.1800 range, indicating fading bullish momentum. A golden cross formed by the 50-day and 200-day moving averages offers medium-term support. Price sits below the Bollinger middle band, while MACD suggests weakening momentum with mixed signals. A potential inverse head and shoulders and ascending triangle patterns are developing, hinting that a break above 1.1800 could trigger a bullish rally.
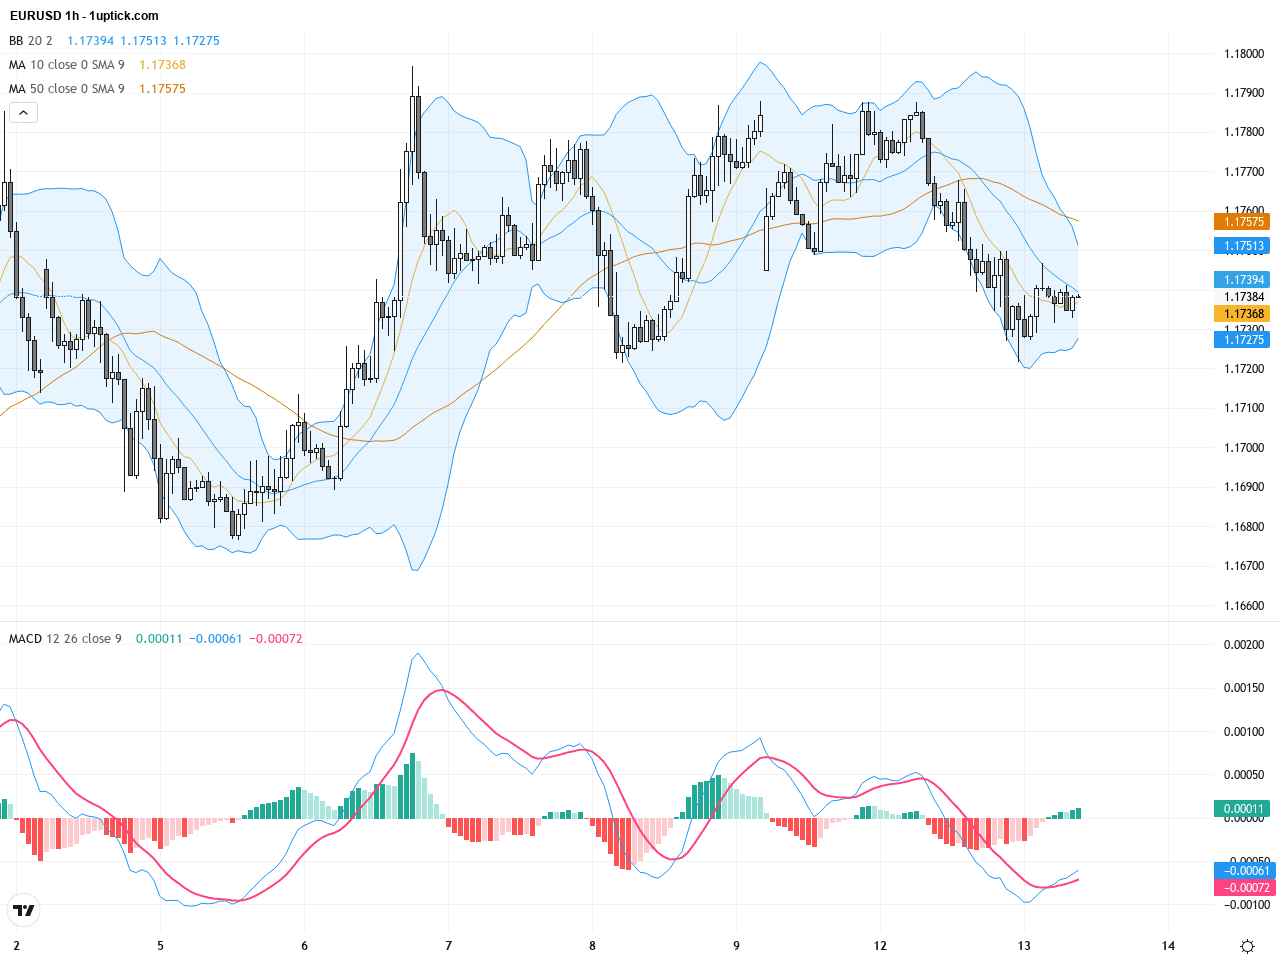
The hourly chart over the past five days reveals increased volatility between 1.1650 and 1.1750. Short-term moving averages are intertwined, showing indecision. The widening Bollinger Bands suggest higher intraday volatility. Recently, MACD lines have crossed and RSI ranges between 45-55, implying bullish attempts that need a decisive break above 1.1750 to continue. Recent hammer candlesticks indicate possible rebounds within the next 24 hours.
Technical Trend: EURUSD is currently in a cautiously bullish consolidation phase, showing sideways movement as market participants await key level breakouts.
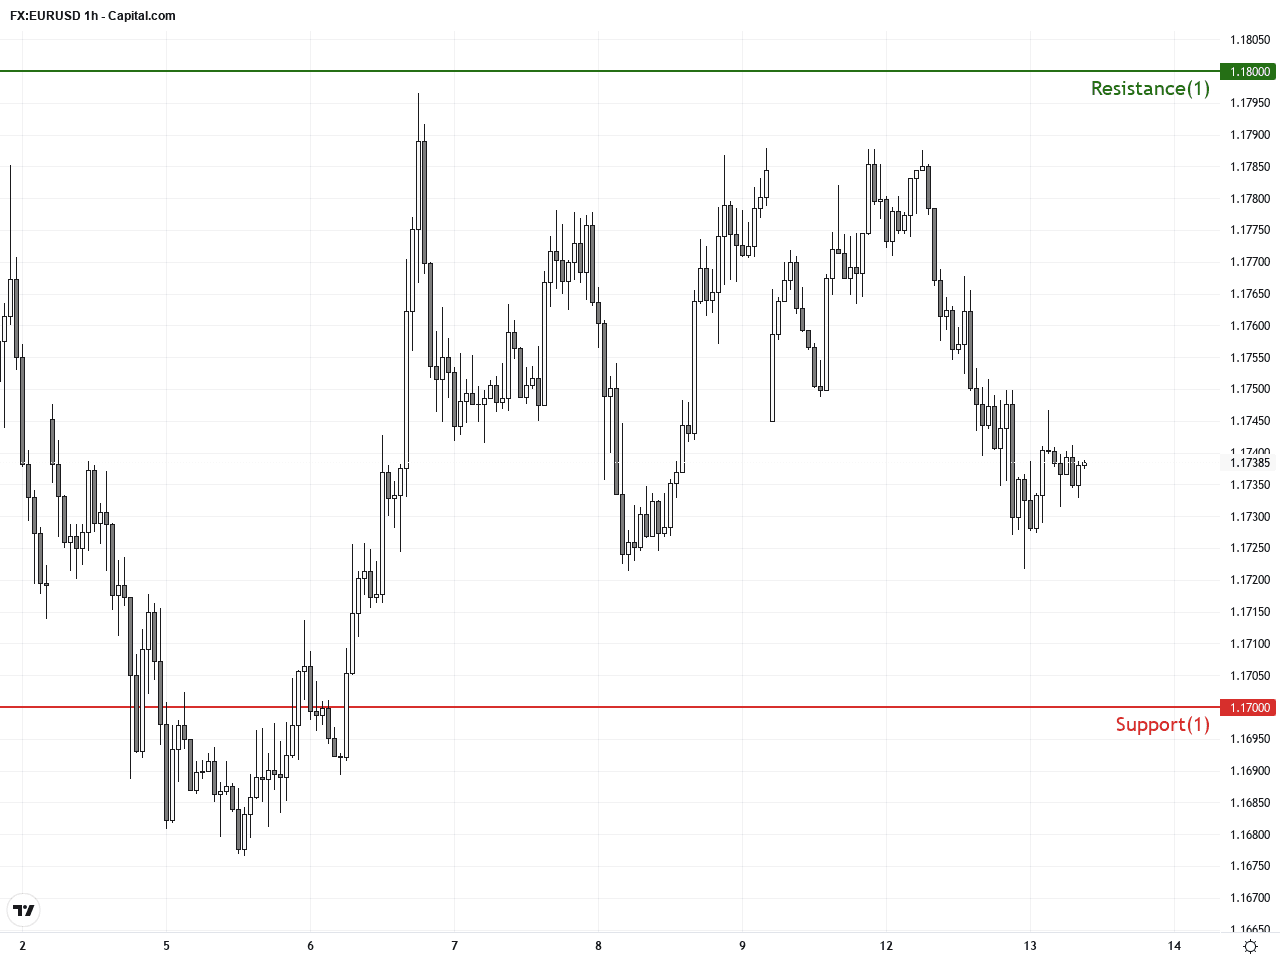
Technically, EURUSD is consolidating within a triangle pattern on the daily chart, oscillating between 1.1700 and 1.1800. MACD momentum is weakening, signaling a critical juncture for bulls and bears. On the hourly chart, hammer candlesticks and MACD cross suggest short-term rebound opportunities, yet a break above the mid-term resistance at 1.1750 is needed to confirm momentum shift. Volume accompanying any rallies will be key to sustain upward momentum. Traders should watch 1.1700 support closely; a break below would open doors to further declines while a break above 1.1780 could confirm a bullish trend resumption.Today’s GMT+1 economic calendar features several releases with limited immediate impact on EURUSD. The Eurozone will release revised Q1 GDP and industrial production data at 11:00, with expectations of slight slowing growth and production. Weaker than expected figures could weigh on the euro. The US will report April Producer Price Index data at 14:30; higher-than-expected inflation could boost the dollar, pressuring EURUSD lower. Overall, no major direct event is expected to cause immediate price swings but market participants should monitor these indicators for future direction.
Resistance & Support
The above financial market data, quotes, charts, statistics, exchange rates, news, research, analysis, buy or sell ratings, financial education, and other information are for reference only. Before making any trades based on this information, you should consult independent professional advice to verify pricing data or obtain more detailed market information. 1uptick.com should not be regarded as soliciting any subscriber or visitor to execute any trade. You are solely responsible for all of your own trading decisions.