










 |
| Gold V.1.3.1 signal Telegram Channel (English) |
EURUSD: Triangle Pattern Completion Signals Pending Breakout Amid Dollar Strength, May 27, 2026
2026-05-27 @ 09:01
Over the past 24 to 48 hours, the EUR/USD exchange rate has prominently reflected the dynamic interplay between the US dollar and geopolitical tensions, particularly amid escalating complexities in the Middle East. Yesterday’s closing price was 1.16378, with signs of recovery today as the pair reached around 1.17313, indicating a gradual return of market optimism regarding peace negotiations.
Recent news on the Iran nuclear deal talks and emerging hopes for peace have significantly reduced geopolitical risk premiums across currency and energy markets, resulting in a softer dollar and a supported euro. Meanwhile, oil prices have declined on the back of these peace prospects, lessening the energy price support for the dollar and indirectly boosting the euro. Investors and traders have maintained a cautious stance, with the pair encountering resistance in the 1.1660 to 1.1675 range and short-term movements driven by multiple news events.
For the average investor, the recent fluctuations of EUR/USD illustrate a direct reflection of global political trends and US policy adjustments. When geopolitical conflicts ease and peace sentiments rise, the dollar typically weakens, pushing the exchange rate higher; conversely, increased tensions boost safe-haven demand for the dollar, constraining the euro. The current market narrative clearly exemplifies this balancing act, and investors should closely monitor further diplomatic developments alongside Federal Reserve and European Central Bank decisions to gauge future exchange rate directions.
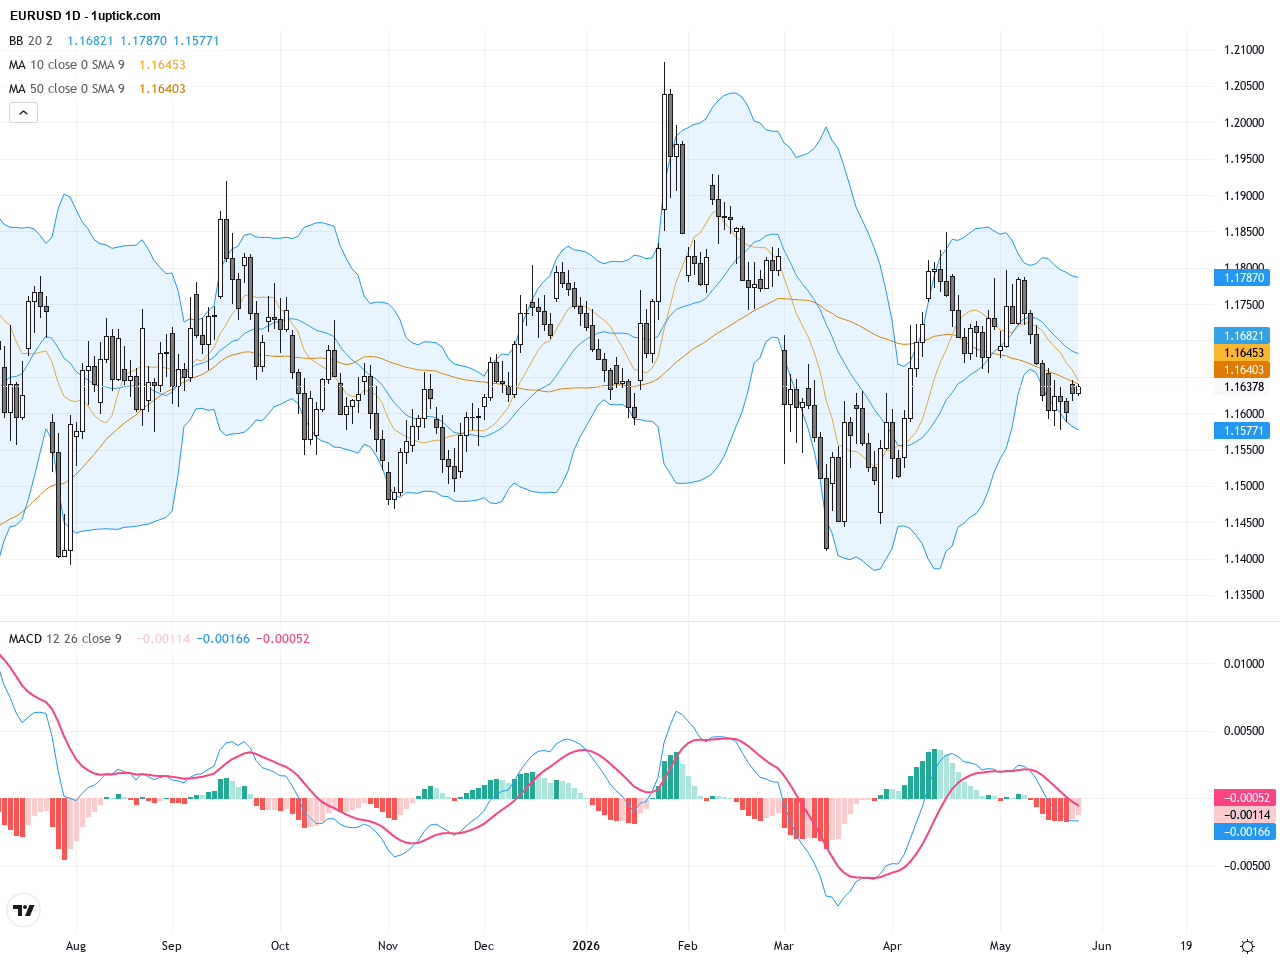
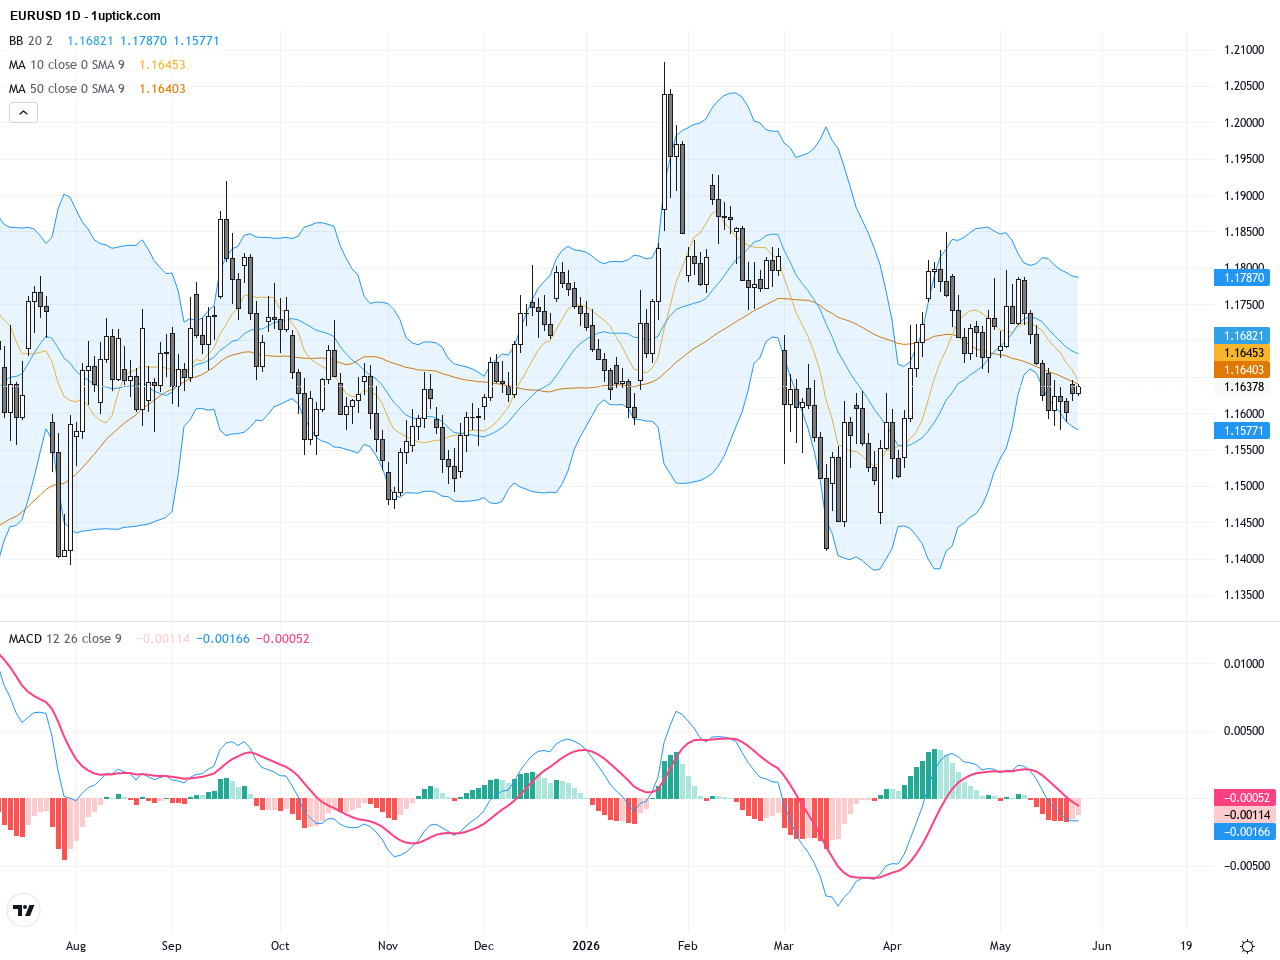
The daily chart indicates EURUSD is consolidating between 1.1550 and 1.1700, displaying a clear range-bound pattern. The 50-day and 200-day moving averages converge near 1.167, posing a considerable resistance zone. Bollinger Bands suggest low volatility with narrowing bands signaling an impending volatility expansion. The MACD oscillates near the zero line without a definitive trend, suggesting a wait-and-see stance in the short term.

The hourly chart over the past 3-5 days reveals a tightening symmetrical triangle, with price nearing the apex. Short-term moving averages flatten as prices test support around 1.162 and resistance near 1.167. MACD histogram shows mild divergence, and the RSI sits near neutral 50, indicating a lack of strong momentum. This pattern suggests traders are anticipating a breakout direction.
Technical Trend: Current technical indicators denote that EURUSD is in a cautious consolidation phase, with a mild upward bias, pending a confirmed breakout to define the next directional trend.
From a technical perspective, the EURUSD symmetrical triangle is a pivotal formation to watch. A breakout above or below this pattern will likely trigger a strong directional move. Recent intraday signals such as a hammer candlestick indicate short-term buying pressure. Coupled with potential MACD crossover and volume expansion, this sets up for a potential trade opportunity. The narrowing Bollinger Bands also indicate that volatility is poised to increase, so traders should stay alert.Today’s GMT+1 economic calendar lacks major direct-impact events for EURUSD. The Bank of Japan Governor’s speech and New Zealand’s policy updates may influence Asia-Pacific markets but have minimal direct effect on Euro-Dollar pairing. The US Richmond Manufacturing Index at 16:00 GMT+1 might impact the USD; a stronger reading could bolster the dollar and influence EURUSD moves. Overall, no significant economic releases are expected to decisively move EURUSD today.
Resistance & Support

The above financial market data, quotes, charts, statistics, exchange rates, news, research, analysis, buy or sell ratings, financial education, and other information are for reference only. Before making any trades based on this information, you should consult independent professional advice to verify pricing data or obtain more detailed market information. 1uptick.com should not be regarded as soliciting any subscriber or visitor to execute any trade. You are solely responsible for all of your own trading decisions.