 |
| Gold V.1.3.1 signal Telegram Channel (English) |
GBPUSD: Key Resistance at 1.3400 in Focus Amid Technical Reversal and Trading Outlook, May 15, 2026
2026-05-15 @ 13:01
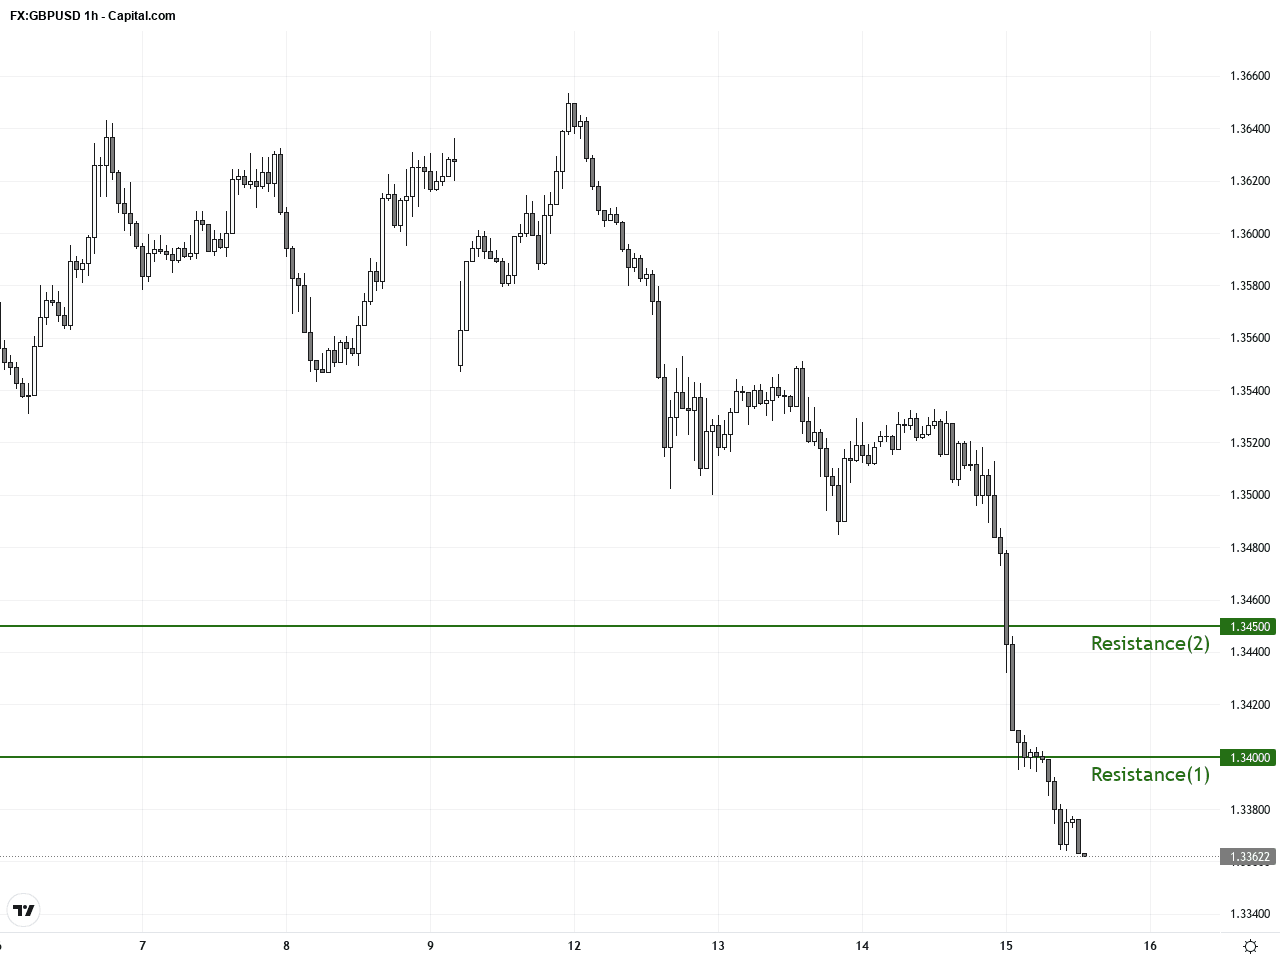
Over the past 48 hours, GBP/USD experienced notable volatility, dropping from yesterday’s closing price of 1.34017 to around 1.33631. The market reacted to heightened political uncertainty in the UK, following the resignation of Health Secretary Wes Streeting, alongside a stronger US dollar driven by disappointing US labor data and ongoing US-Iran tensions.
At the same time, stronger-than-expected UK GDP and manufacturing figures provided some support to the pound, indicating underlying economic resilience despite short-term swings. Investors remain focused on the Federal Reserve’s hawkish stance and global geopolitical risks, which continue to shape this major currency pair’s movements.
For the typical investor, this environment can be likened to weathering a storm — where political shocks feel like sudden gusts disturbing markets, but solid economic fundamentals offer a sturdy shelter. This underscores the importance of balancing awareness of immediate news with an understanding of economic fundamentals when navigating the forex market.

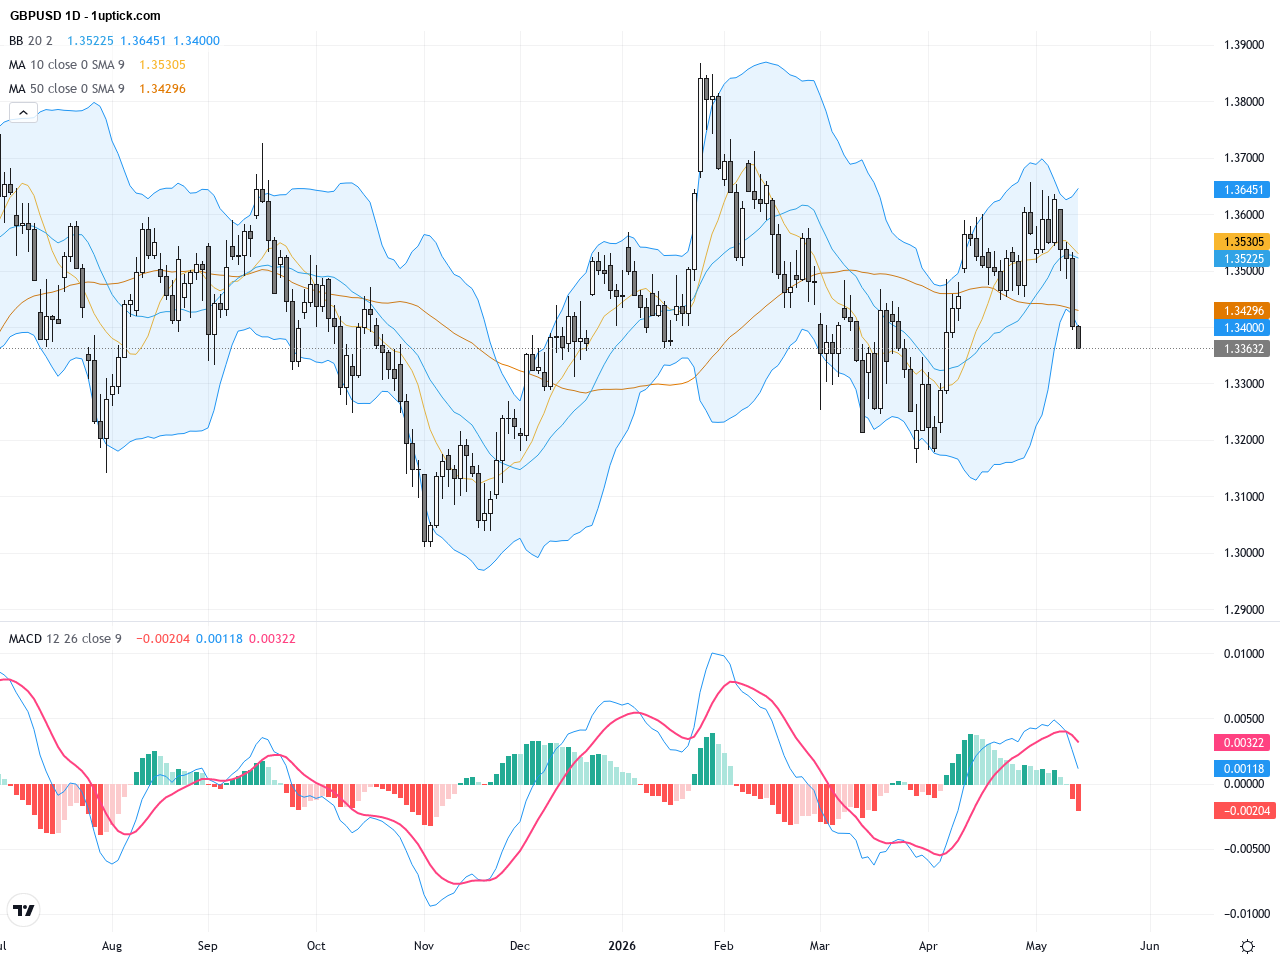
The daily chart displays a long-term downtrend for GBPUSD since the start of the year, with recent price action ranging between 1.3300 and 1.3400. The pair trades below its 50-day (1.34356) and 200-day (1.34048) moving averages, indicating bearish short-term momentum. Bollinger Bands are contracting, signaling reduced volatility but hinting at an imminent breakout. The MACD remains in negative territory with the fast and slow lines nearing a crossover, suggesting selling pressure persists but a potential trend change could be underway if price breaks above 1.3400 resistance.
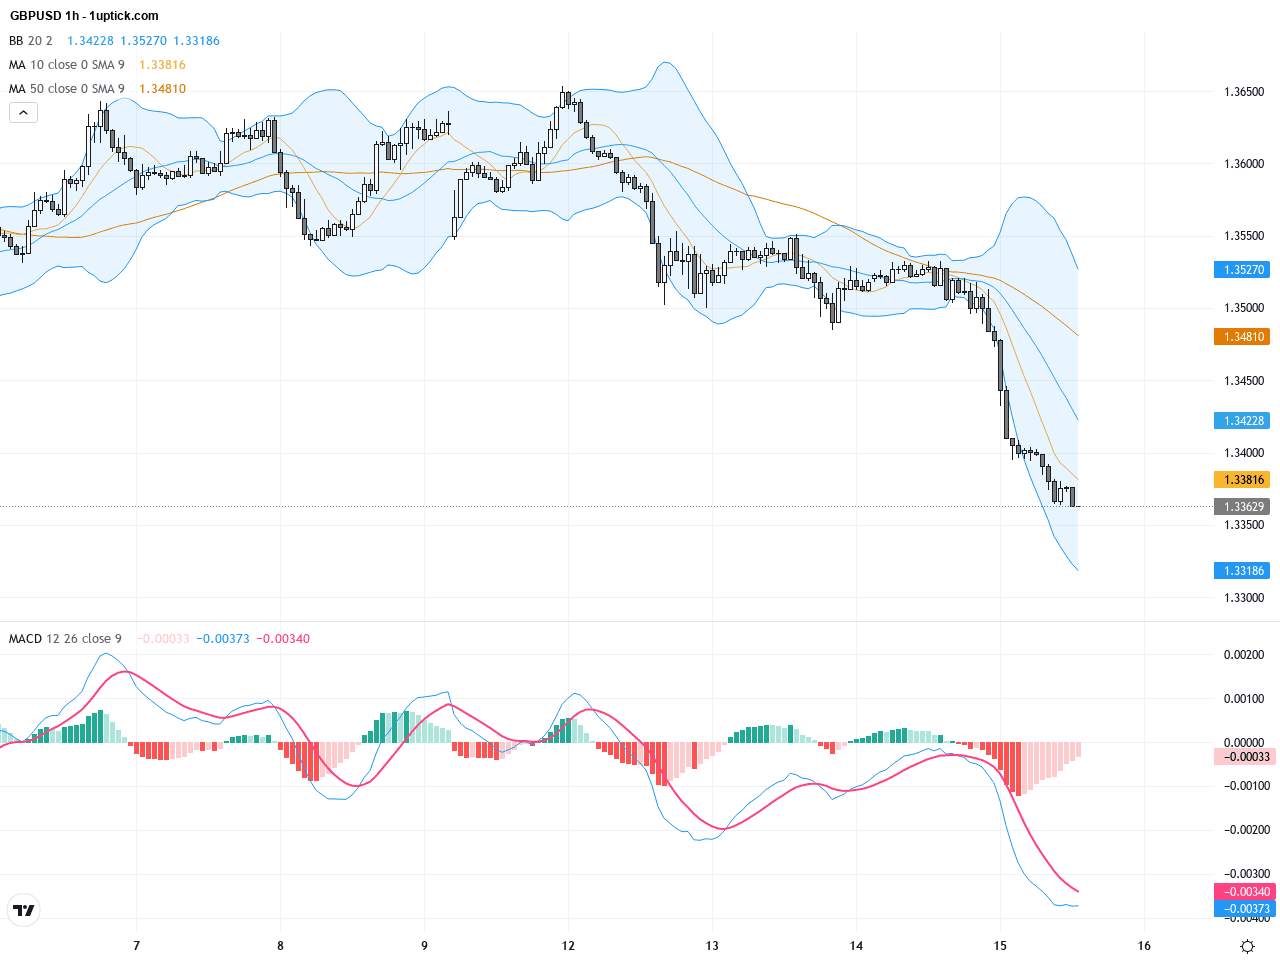
On the hourly chart covering the last 3-5 days, GBPUSD shows a consolidative pattern with a rising 20-period moving average offering support near 1.3340. The MACD has recently formed a bullish crossover, and RSI hovers near the neutral 50 mark, supporting a potential short-term rebound. The middle Bollinger Band acts as solid support, with the price needing to break the near-term resistance around 1.3400 to confirm a trend reversal from the small consolidation flag pattern.
Technical Trend: GBPUSD is experiencing a cautious short-term rebound within an overall consolidative phase on the daily timeframe.
GBPUSD is currently at a pivotal technical juncture between short-term 20-day moving average support and its psychological resistance near 1.3400. The bullish hourly MACD crossover points to a possible rebound, but the daily MACD remains bearish, calling for caution. Bollinger Bands on the daily chart are tightening, suggesting a significant volatility expansion is approaching. The pair appears to be forming a flag consolidation pattern whose breakout direction will likely set the near-term trend. Additionally, the recent small bullish engulfing candlestick indicates a pause in selling pressure, favoring short-term buyers.Today’s economic calendar has no directly impactful UK or US releases for GBPUSD. Key events include the US NY Empire State Manufacturing Index and US industrial production data. Stronger than expected US data could bolster the dollar, weighing on GBPUSD, while weaker outcomes may provide upward momentum for the pair. Market participants should watch these releases closely for reaction cues in the second half of the trading day.
Resistance & Support
The above financial market data, quotes, charts, statistics, exchange rates, news, research, analysis, buy or sell ratings, financial education, and other information are for reference only. Before making any trades based on this information, you should consult independent professional advice to verify pricing data or obtain more detailed market information. 1uptick.com should not be regarded as soliciting any subscriber or visitor to execute any trade. You are solely responsible for all of your own trading decisions.