 |
| Gold V.1.3.1 signal Telegram Channel (English) |
USDCAD: Key Resistance at 1.3600 Limits USD Strength Amid Oil Price Countermove, May 5, 2026
2026-05-05 @ 13:01
Over the past 24 to 48 hours, the USD/CAD pair has experienced notable volatility, particularly showing hesitation above the 1.3600 mark. The closing price yesterday hovered around 1.3628, reflecting a continued sideways consolidation within a narrow range.
The primary market drivers stemmed from escalating geopolitical tensions abroad. Rising US-Iran conflicts, especially increased risks in the Strait of Hormuz, fueled risk-aversion and supported the US dollar against the Canadian dollar. At the same time, a rebound in oil prices provided substantial support to the Canadian dollar, tempering the USD’s advance and leading to a tug-of-war in the 1.3550 to 1.3650 range.
For the average investor, the recent price action can be likened to a soccer match with two closely matched teams exchanging control. The US dollar gains short-term momentum thanks to geopolitical risks, but the rise in oil prices bolsters the Canadian dollar, creating a stalemate. Looking ahead, if Middle East tensions escalate further, the USD might gain more ground; conversely, a drop in oil prices could enable the CAD to bounce back.

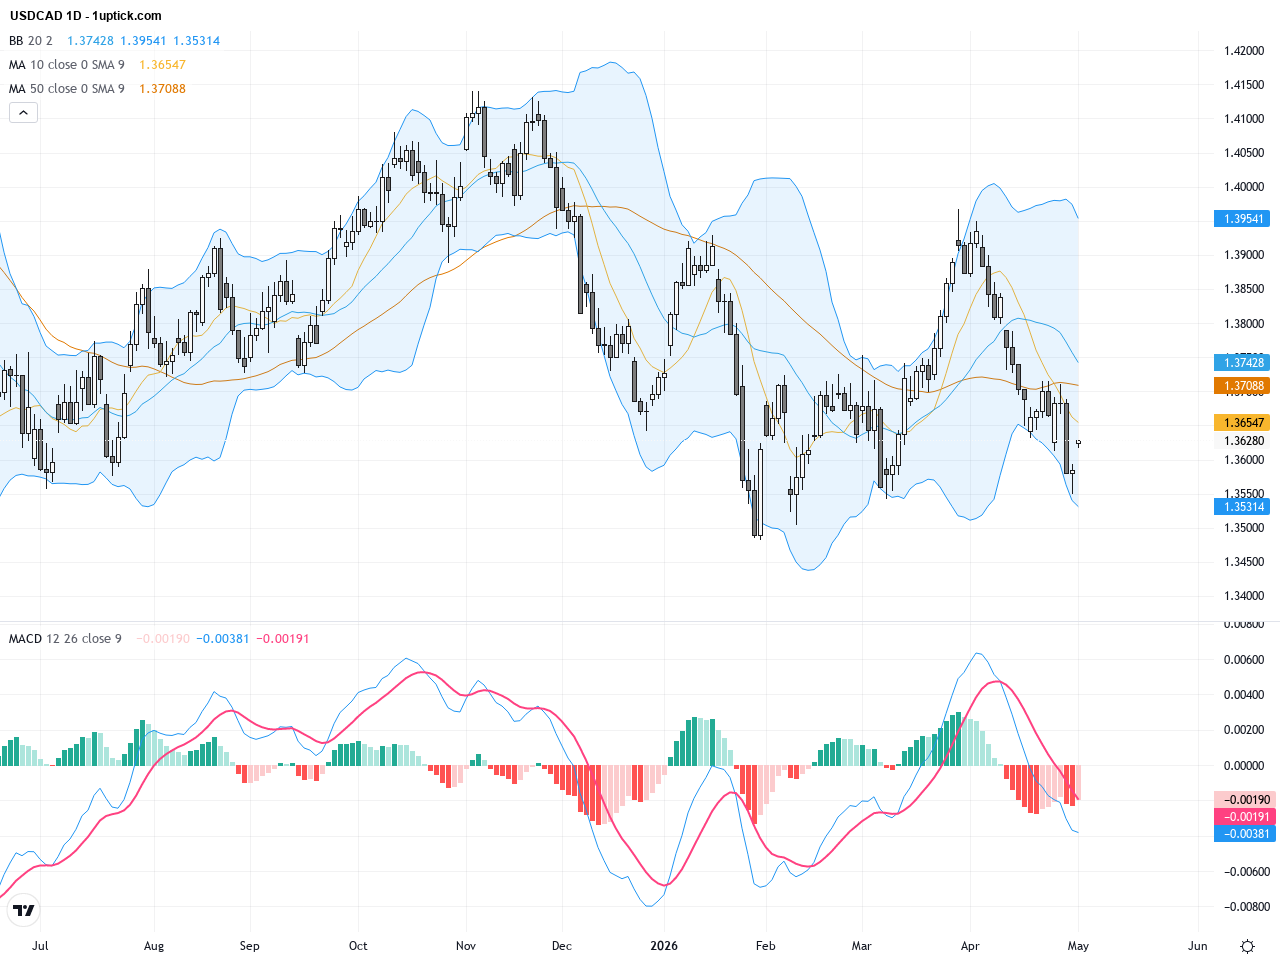
The daily chart reveals that since the March low of 1.34813, USDCAD has rebounded but failed to breach the resistance formed by the 50-day moving average near 1.3740 and the 200-day moving average around 1.3820. Bollinger Bands show contraction suggesting reduced volatility, while the MACD hovers near the zero line with a slight upward tilt, indicating balanced but slightly bullish momentum. Overall, the daily chart highlights a consolidating market without a definitive trend breakout.
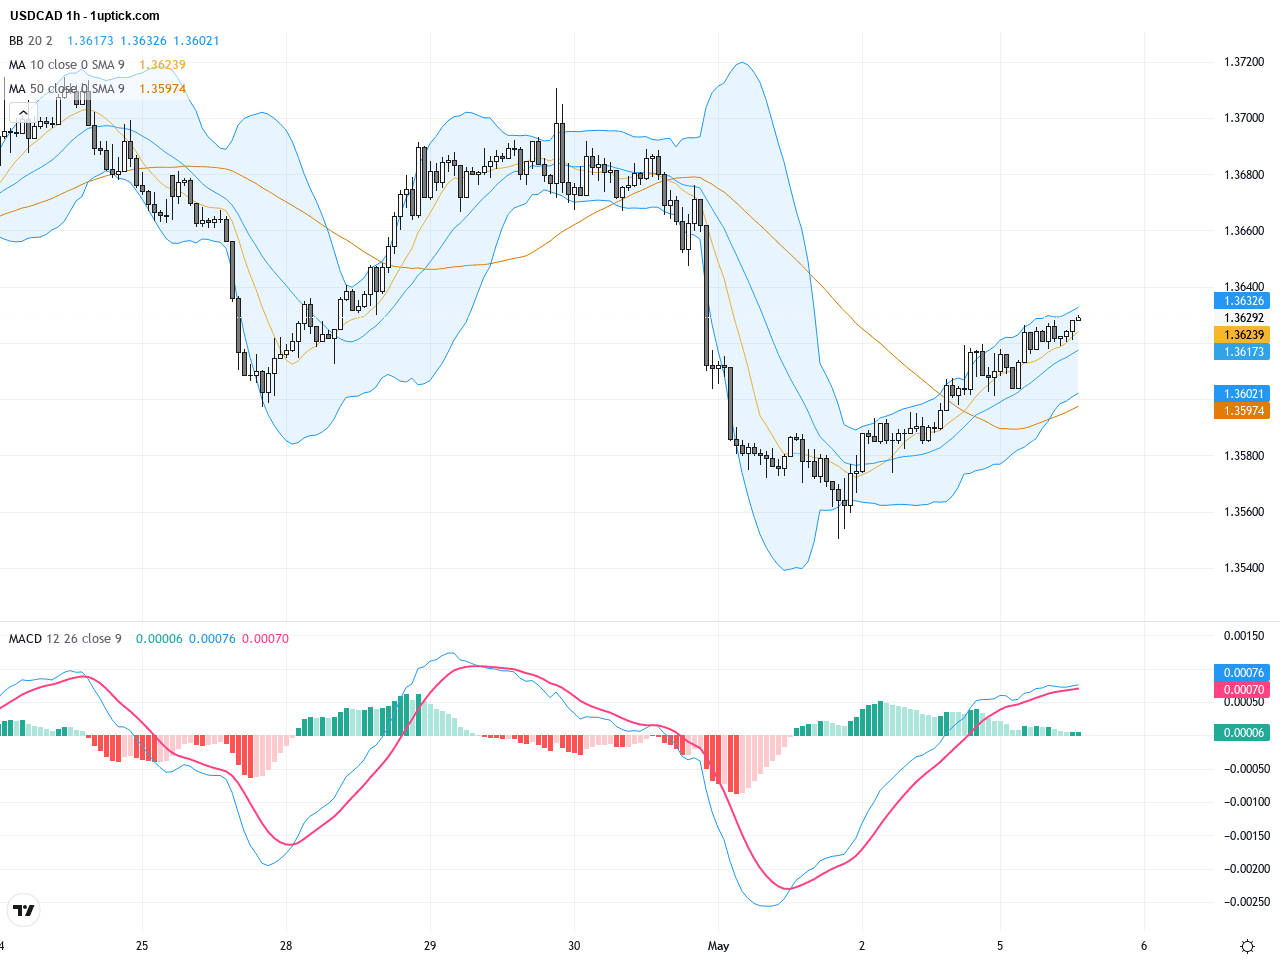
On the hourly chart, USDCAD has been trading within a tight 1.3550 to 1.3630 range over the last 3-5 days. The pair repeatedly tested and held the 1.3550 support while recently challenging the 1.3625-1.3630 resistance band. The 10- and 20-period moving averages are converging with a mild upward trend, signaling short-term bullish strength. Bollinger Bands have widened slightly, reflecting increased short-term volatility, and the MACD has formed a bullish crossover, hinting at sustained upward momentum over the near term.
Technical Trend: USDCAD is in a cautiously sideways consolidation, with no clear directional trend. Market participants should remain patient for decisive breakout signals.
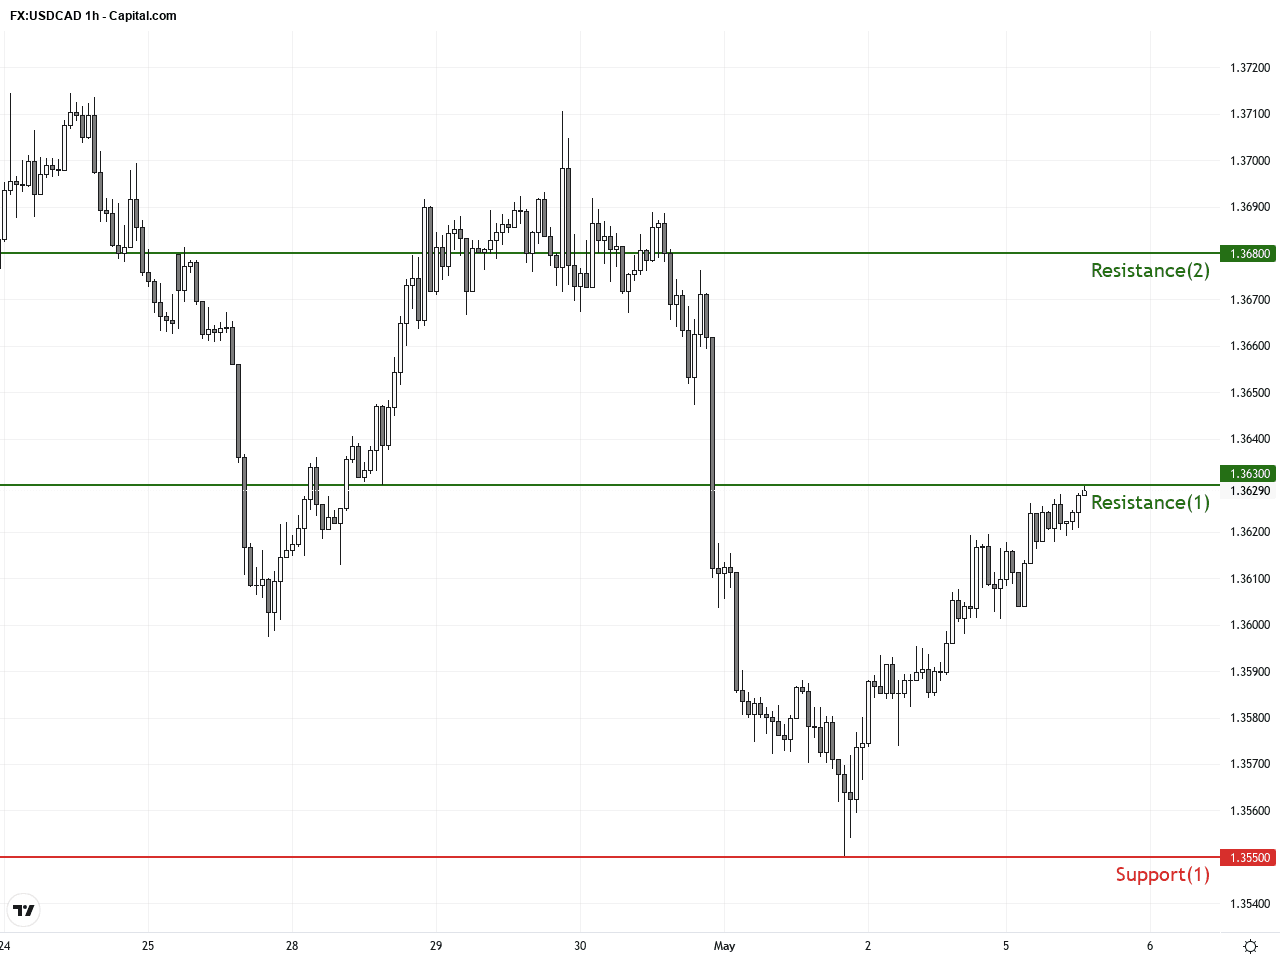
Technically, USDCAD is currently trading within a clear box range with support near 1.3550 and resistance between 1.3600-1.3630. Daily MACD oscillates near neutral, while the hourly chart’s MACD bullish crossover and recent bullish engulfing candlestick suggest upward momentum gathering. Nonetheless, tight moving average convergence and proximity to the Bollinger mid-band signal the momentum needs confirmation before a strong breakout. Traders should closely watch for a break above 1.3630 or a rejection to gauge next directional bias.There are no major Canadian or US economic releases scheduled today directly impacting USDCAD. Important events such as the Australian interest rate decision and EU council meetings have less direct relevance to this pair. However, the weekly API Crude Oil Inventory report due at 22:40 GMT+1 is critical. A larger-than-expected drawdown could boost oil prices further, applying downward pressure on USD strength against CAD. Traders should watch this data keenly as it could shift short-term USDCAD dynamics.
Resistance & Support
The above financial market data, quotes, charts, statistics, exchange rates, news, research, analysis, buy or sell ratings, financial education, and other information are for reference only. Before making any trades based on this information, you should consult independent professional advice to verify pricing data or obtain more detailed market information. 1uptick.com should not be regarded as soliciting any subscriber or visitor to execute any trade. You are solely responsible for all of your own trading decisions.