


 |
| Gold V.1.3.1 signal Telegram Channel (English) |
USDCAD Trading Outlook: Bullish USD Push with Key Resistance Levels in Focus, May 28, 2026
2026-05-28 @ 13:01
Over the past 48 hours, the US Dollar to Canadian Dollar (USD/CAD) market showed cautious upward movement, with prices hovering around yesterday’s close at 1.3861 and fluctuating between lows of 1.38319 and highs of 1.38696. This price action was primarily driven by rising geopolitical tensions. Developments regarding a potential US-Iran agreement and policy moves by the Bank of Canada became central market themes.
The US Dollar remained favored amid growing risk-off sentiment, with USD/CAD staying above 1.38, reflecting dollar strength against the loonie. Despite weakening oil prices weighing on the Canadian dollar, investors remain cautious, considering the unfolding Iran deal and divergent monetary policies between the Fed and the BoC. This has helped sustain some buying interest in the US Dollar, pushing USD/CAD higher in the short term.
For the average investor, this means the US Dollar is currently benefiting from global political and energy-related uncertainties, providing some support to the USD/CAD pair. If you hold Canadian dollar assets, you may notice a slight uptick in the exchange rate reflecting rising demand for the relative safety of the US Dollar.
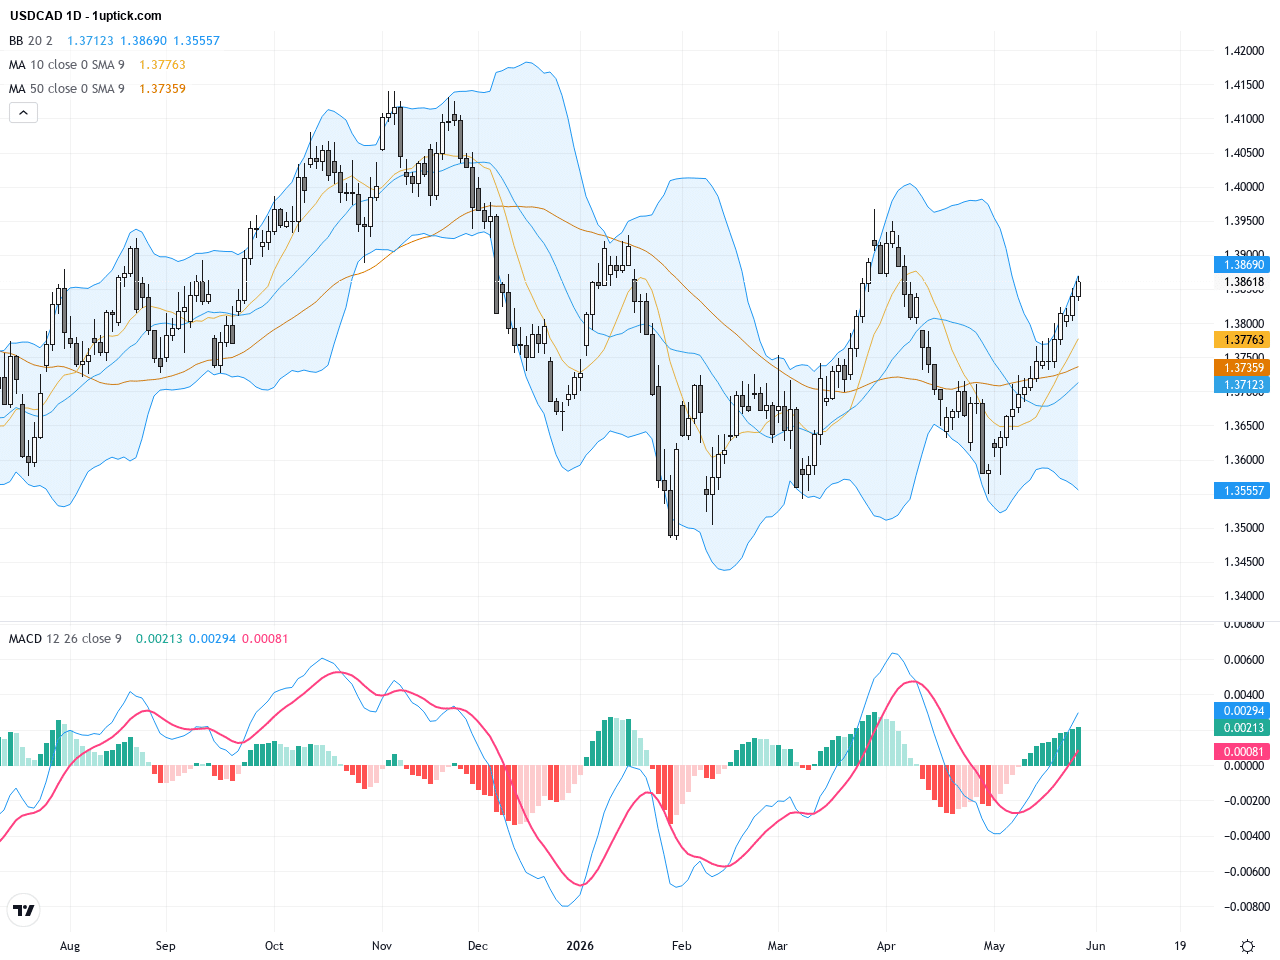
The daily chart shows a sustained uptrend for USDCAD from earlier lows this year, with the pair breaking and holding above the 200-day moving average around 1.3804, signaling strong long-term bullish momentum. Bollinger Bands illustrate price movements along the upper band, and the MACD histogram remains positive and trending upward, supporting continued bullish strength. Currently, price is consolidating near highs, indicating a pause before the next directional move.
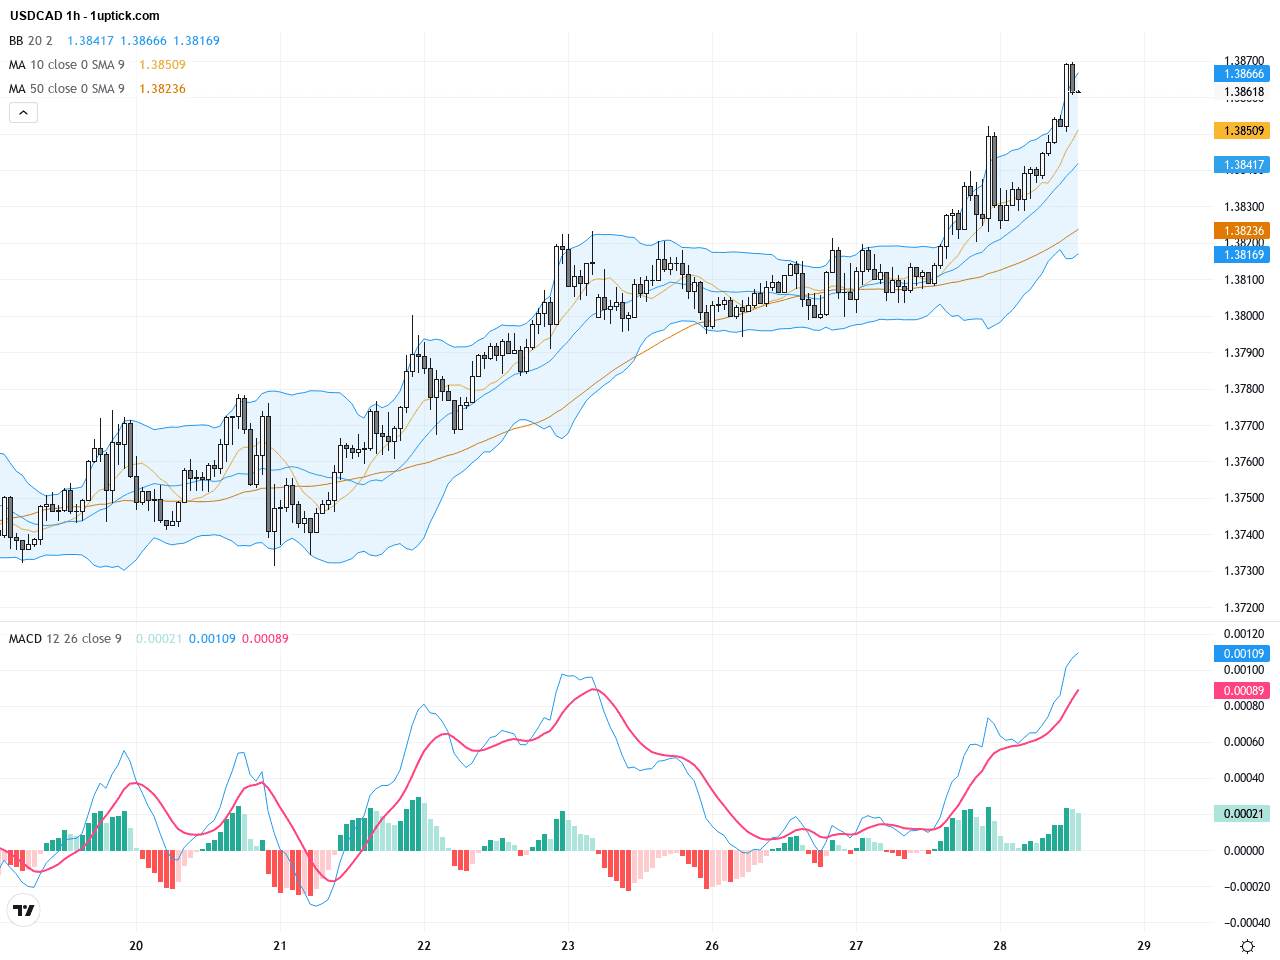
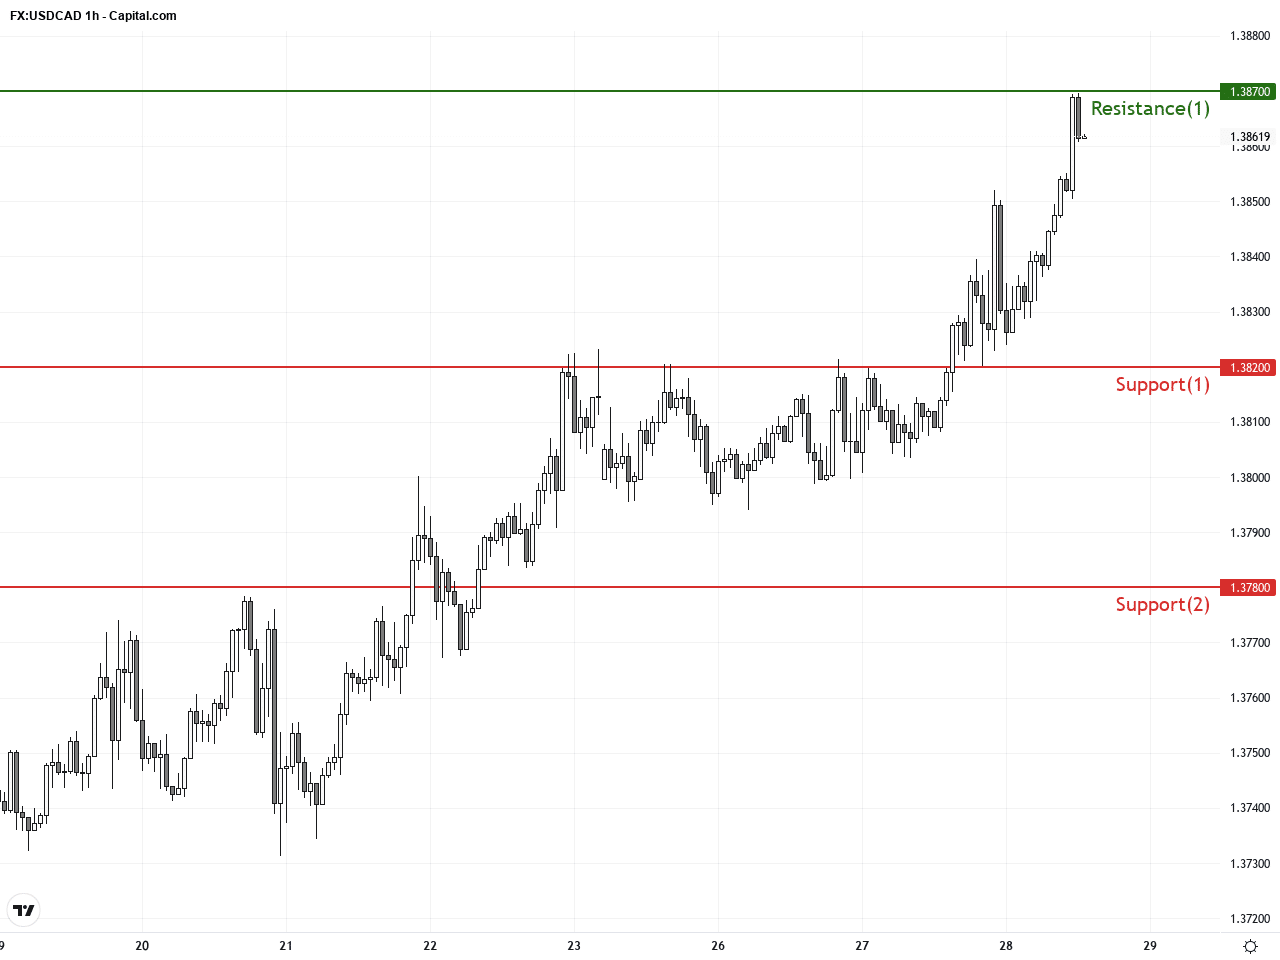
The hourly chart over the past 3-5 days depicts price oscillating between 1.383 and 1.387 with the 20 EMA providing support. The MACD forms a bullish crossover (golden cross), indicating positive short-term momentum. Bollinger Bands narrowing signals decreasing volatility, suggesting a breakout could be imminent. Key resistance is seen at 1.3870, with support near 1.3820, as the market awaits impactful US and Canadian economic data and central bank commentary.
Technical Trend: Sustained bullish trend with consolidation, overall bias decisively bullish
USDCAD technical setup shows clear bullish elements: MACD remains positive with a recent golden cross, and Bollinger Bands tightening suggests a potential imminent breakout. The daily breach and hold above the 200-day MA reinforce the bullish case. However, 1.3870 area remains a near-term resistance pivot. Traders should monitor today’s US core PCE inflation data and Canadian account figures closely, as well as broader USD sensitivity to geopolitical concerns, for high-probability trade entries.Today’s economic calendar features key US and Canadian data relevant to USDCAD including Canada’s Q1 current account and various US April PCE inflation and GDP revisions, scheduled for release around 21:30 Hong Kong time. Stronger than expected US data would likely bolster USD strength and favor USDCAD upside, while weaker outcomes could temper gains. FOMC member speeches scheduled earlier add another layer of potential volatility and market reaction.
Resistance & Support
The above financial market data, quotes, charts, statistics, exchange rates, news, research, analysis, buy or sell ratings, financial education, and other information are for reference only. Before making any trades based on this information, you should consult independent professional advice to verify pricing data or obtain more detailed market information. 1uptick.com should not be regarded as soliciting any subscriber or visitor to execute any trade. You are solely responsible for all of your own trading decisions.