








 |
| Gold V.1.3.1 signal Telegram Channel (English) |
WTI Crude Oil: Triangle Breakdown Signals Elevated Pullback Risk with Key Support Tested, May 28, 2026
2026-05-28 @ 06:03
Over the past 48 hours, WTI crude oil prices experienced significant volatility, plunging from $93.89 on May 26 to $88.68 on May 27, marking a drop of over 5%. This pullback was primarily driven by the latest reports of US crude and gasoline inventories continuing to shrink. The American Petroleum Institute (API) estimated a crude inventory decline of 2.8 million barrels, intensifying concerns about tighter supply. However, growing optimism around US-Iran peace talks and easing geopolitical tensions in the Middle East have pressured prices, prompting a market correction.
The situation around the Strait of Hormuz remains a pivotal driver. Despite the UAE’s plan to complete a pipeline bypassing Hormuz and recent US military self-defense strikes on Iranian missile sites, President Trump’s occasional strong warnings toward Oman add complexity and uncertainty. This mix of supply risk and diplomatic developments has led to the pronounced price swings seen in WTI recently.
For the average investor, think of WTI’s price journey as a rollercoaster ride influenced by global energy supply worries and shifting geopolitical tensions. If a peace deal materializes between the US and Iran, oil prices may stabilize or cool off, but if tensions flare again, the upside risk remains. Meanwhile, the US stock market hitting record highs reflects ongoing adjustments as investors digest both economic outlooks and material cost changes amid this fluctuating oil landscape.
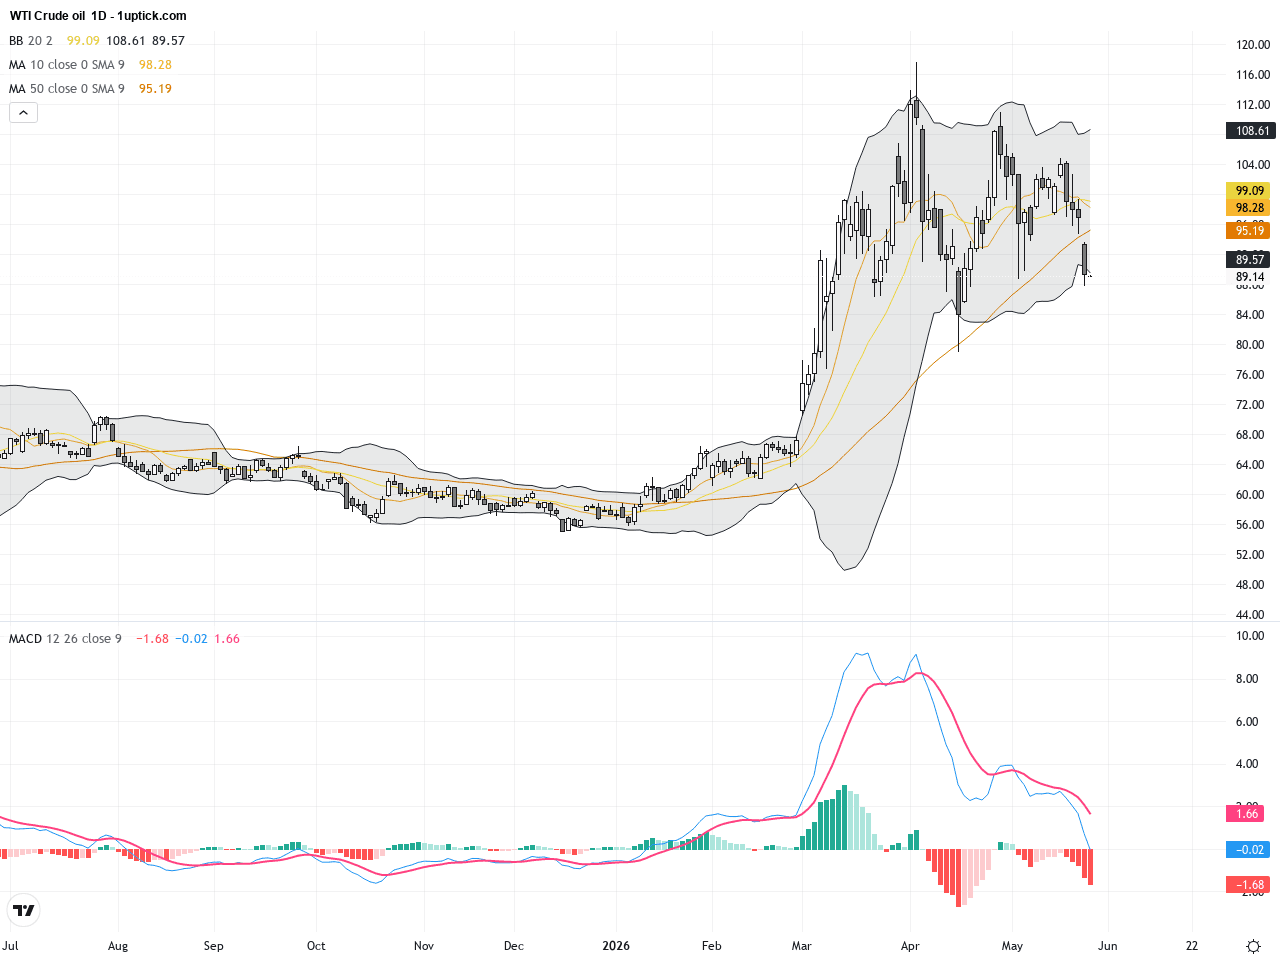
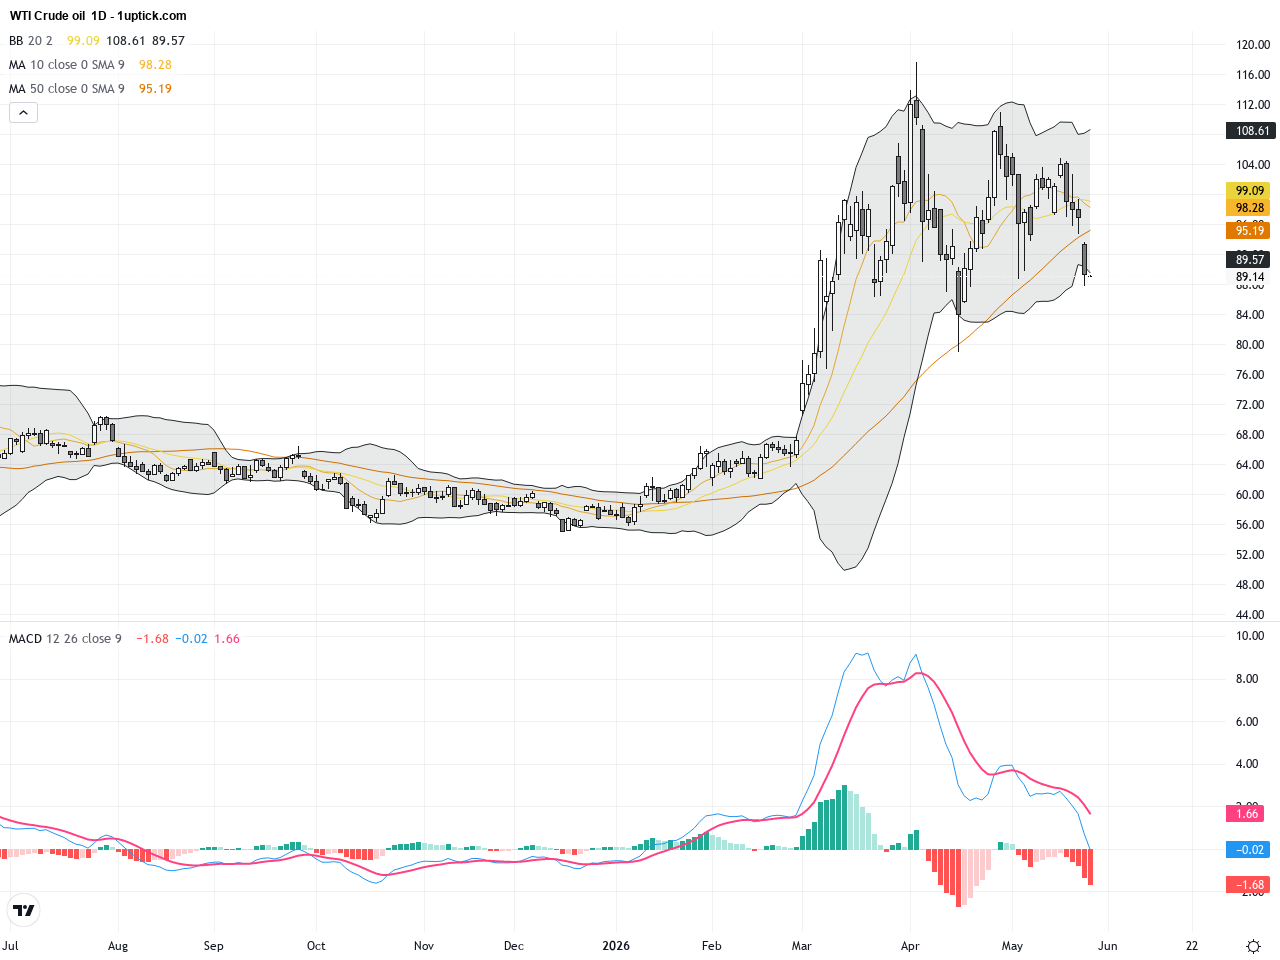
The daily chart of WTI Crude Oil indicates the price was consolidating within a symmetrical triangle pattern over the past weeks and recently broke down below the triangle support, signaling a potential continuation of the downtrend. Moving averages show a bearish crossover, with the 20-day and 50-day MAs diverging downward. The MACD has turned negative with expanding divergence, reflecting increasing selling momentum. Bollinger Bands moved from contraction to downward expansion, highlighting rising volatility. Overall, the daily technicals favor a bearish outlook with room for further decline.
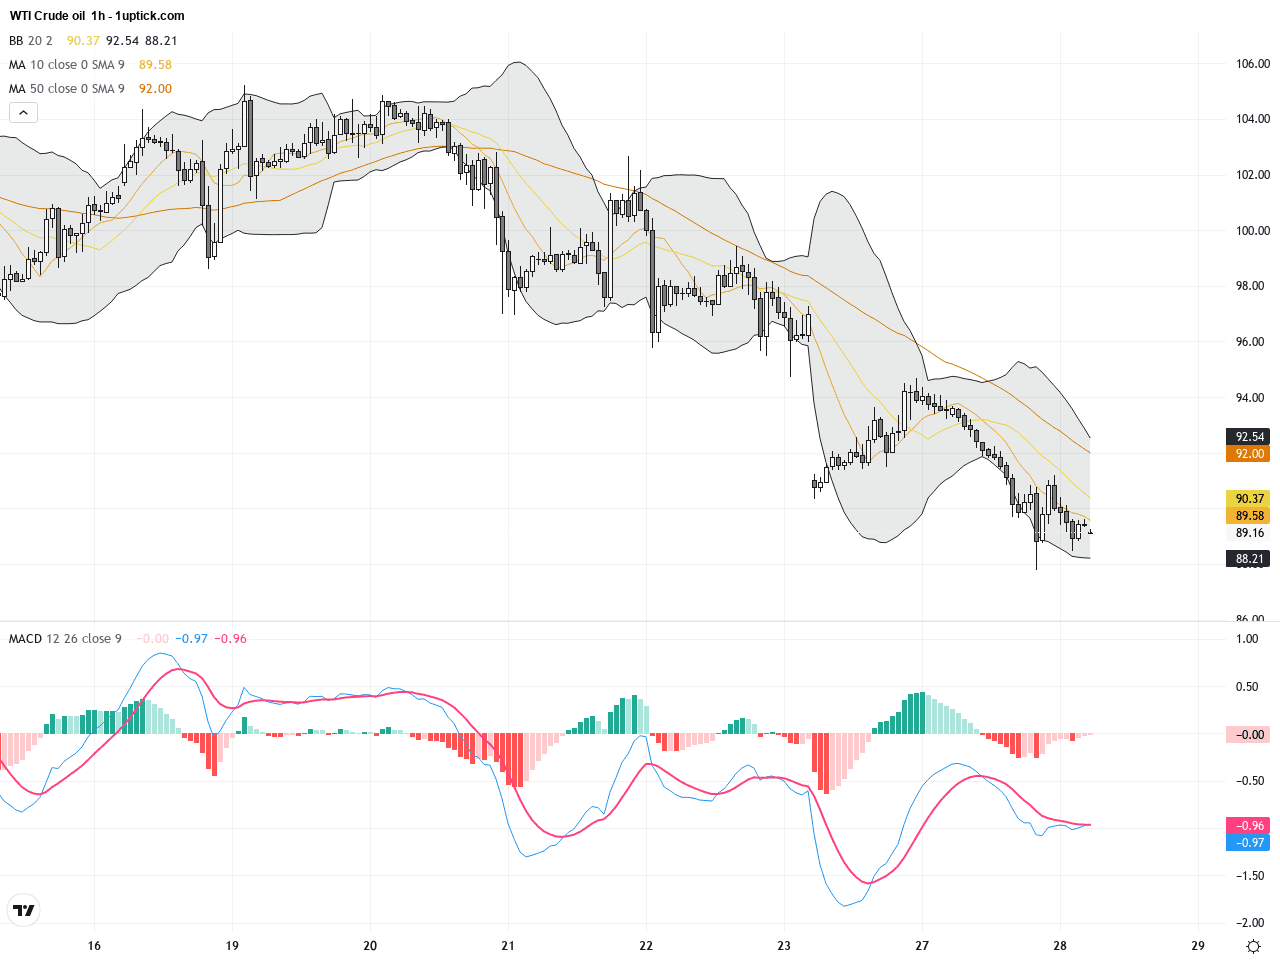
The hourly chart over the last 3-5 trading days shows a rapid selloff with prices dipping to $87.77 yesterday. The lower Bollinger Band has acted as dynamic short-term support, but price has struggled to stabilize above it. The MACD indicates heightened bearish momentum; however, a bullish divergence suggests a possible short-term rebound. The 20-hour moving average is trending down, paired with increasing volume, indicating heightened intraday volatility. The short-term structure remains bearish but watch for potential corrective bounces.
Technical Trend: Trend Direction: Cautiously Bearish
WTI Crude Oil is in a critical phase with technical signals pointing to sustained downside momentum following a triangle pattern breakdown and weakening MACD. Nevertheless, short-term hourly divergences suggest a possible bounce. Overall, the risk environment is elevated, so monitoring key support breaks or rebound strength is vital for anticipating next moves.There are no significant or directly relevant economic events today affecting WTI Crude Oil. Traders should focus on ongoing geopolitical developments and market news for potential price drivers.
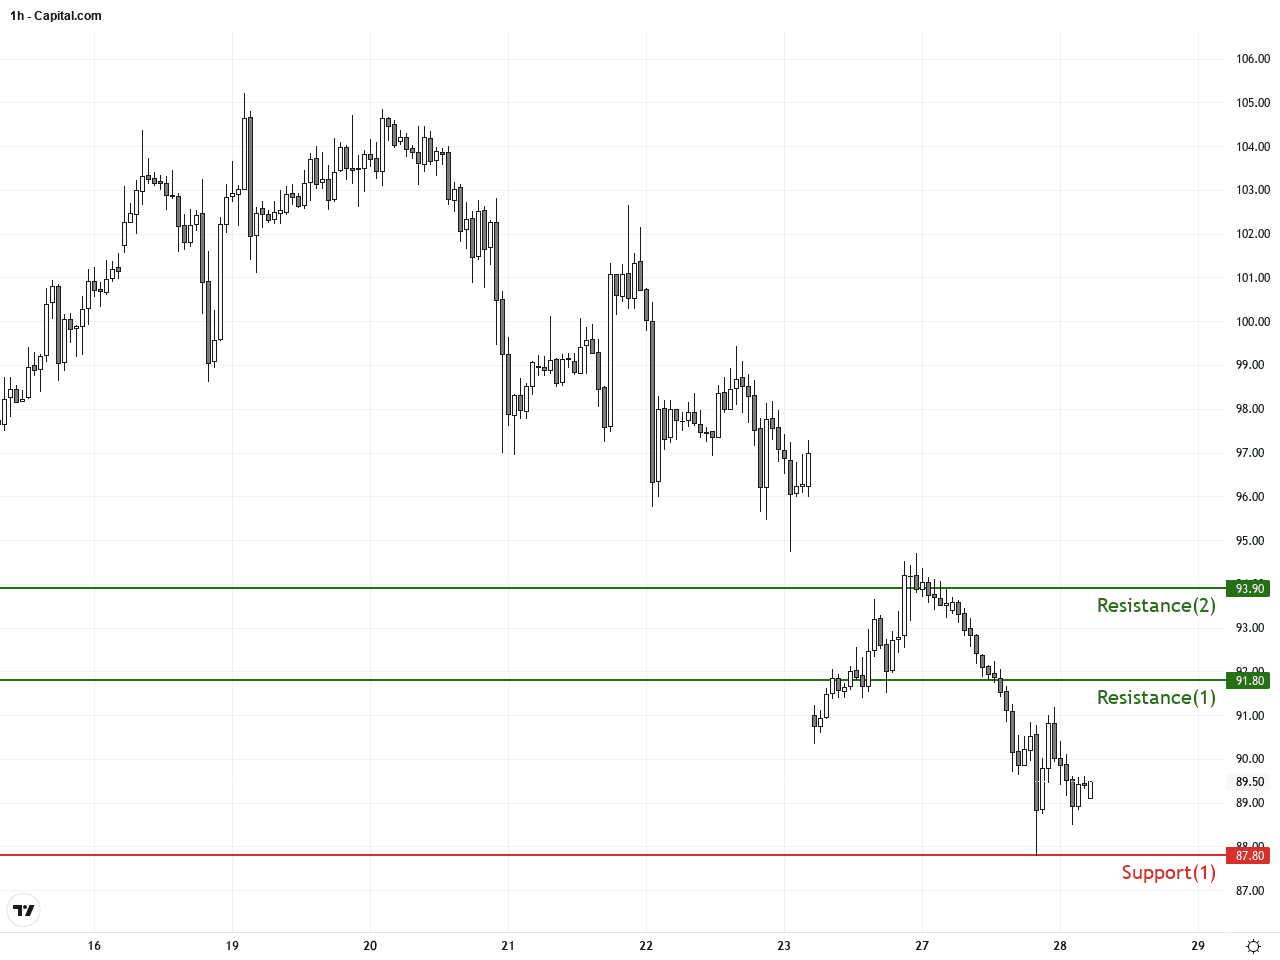
Resistance & Support
The above financial market data, quotes, charts, statistics, exchange rates, news, research, analysis, buy or sell ratings, financial education, and other information are for reference only. Before making any trades based on this information, you should consult independent professional advice to verify pricing data or obtain more detailed market information. 1uptick.com should not be regarded as soliciting any subscriber or visitor to execute any trade. You are solely responsible for all of your own trading decisions.