 |
| Gold V.1.3.1 signal Telegram Channel (English) |

WTI Crude Oil: Bollinger Bands and MACD Signal Volatile Consolidation Amid Middle East Tensions, May 6, 2026
2026-05-06 @ 00:08
Over the past 24 to 48 hours, WTI crude oil prices experienced significant volatility, closing at $106.42 on May 4th, markedly higher than the previous day’s close of $102.16. Monday’s rally was primarily driven by escalating tensions in the Middle East, especially increased conflict around the Strait of Hormuz and fresh attacks on UAE energy infrastructure, which reinforced fears of supply disruptions.
However, on Tuesday, oil prices pared about 3% after the U.S. announced progress on an Iran ceasefire, alongside a ship successfully passing through the Strait of Hormuz. This easing of geopolitical risks boosted investor risk appetite, helping Wall Street major indices rebound, led by tech-heavy Nasdaq. The wild price swings highlighted how geopolitical factors profoundly impact global energy supply-demand dynamics.
For the average investor, think of oil prices like a highly sensitive scale—any worsening international tensions tip it up, while peace signals push it down. These swings directly affect everyday costs from gasoline to airfare. Staying informed on market news and understanding how geopolitical risks influence energy prices can help investors better time their entries and manage risks.
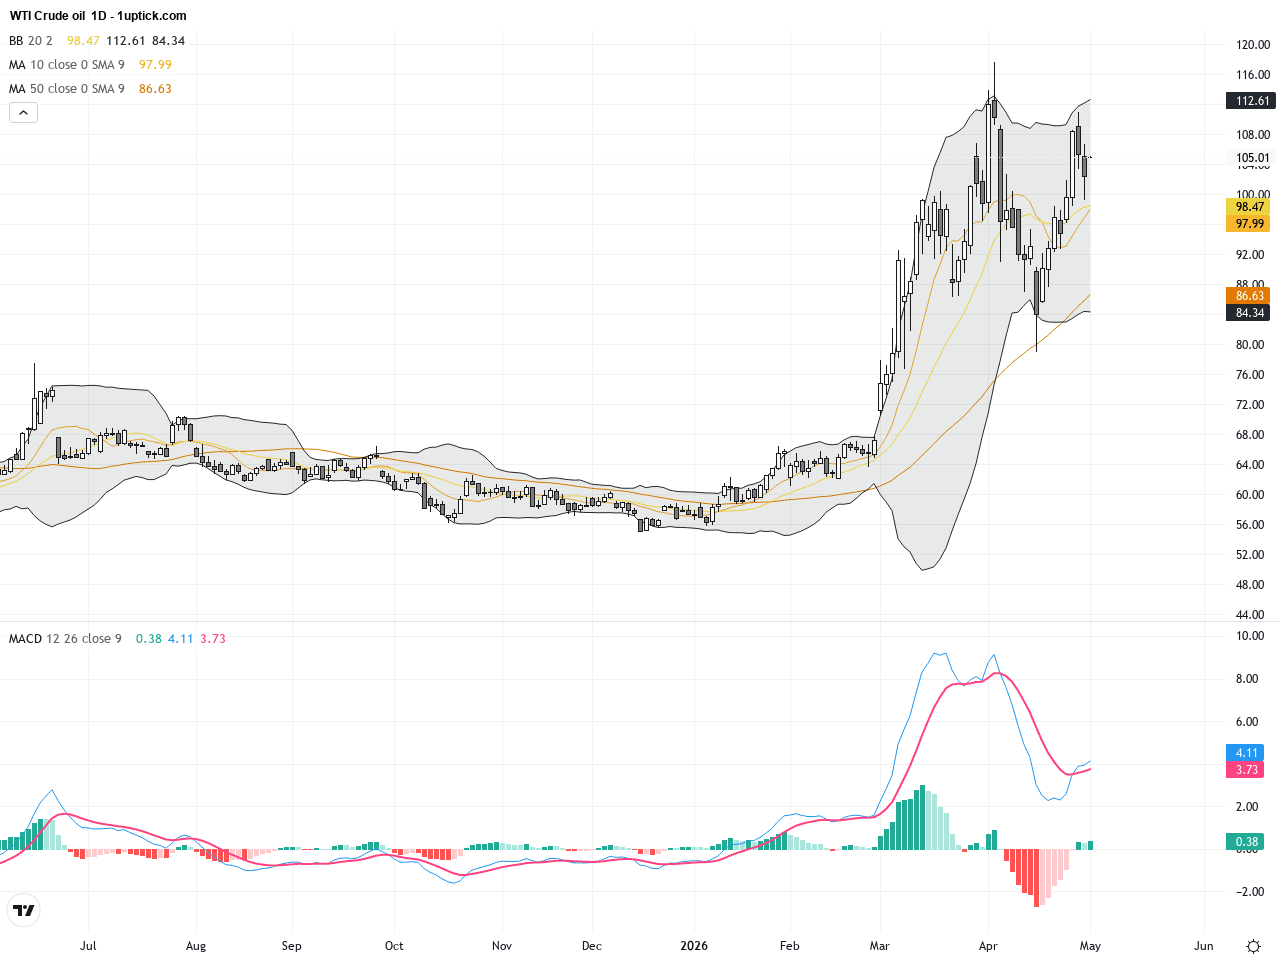
On the daily chart, WTI Crude Oil displays a high-level consolidation pattern, oscillating around the $100 mark. The Bollinger Bands indicate increased volatility with price frequently touching the upper band but failing to break out decisively. The MACD hovers near the zero line with multiple crossovers, suggesting a lack of clear trend direction. Price candlesticks with long upper wicks and bearish engulfing patterns highlight strong overhead resistance, signaling caution for bulls aiming to sustain higher levels.
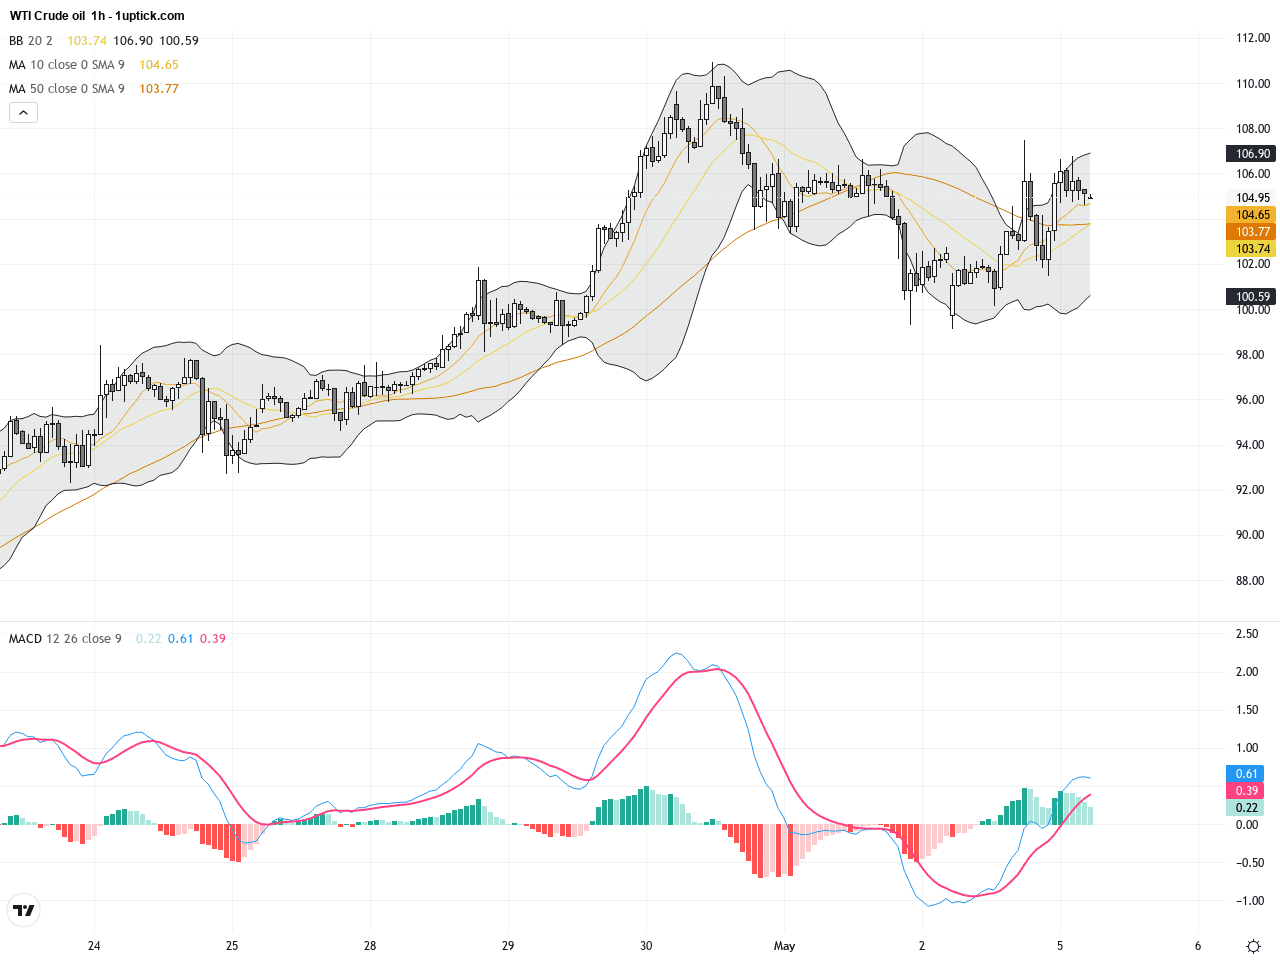
The hourly chart over the past 5 days reveals a tightening triangle pattern, illustrating short-term indecision between bulls and bears. The Bollinger Bands are narrowing, suggesting an imminent breakout. Recently, the MACD experienced a bullish crossover, indicating rising short-term momentum. The appearance of hammer candlesticks near significant support levels further supports potential upward attempts, making a short-term breakout plausible.
Technical Trend: WTI Crude Oil is currently in a cautious consolidation phase with tentative short-term bullish attempts, while the overall trend remains uncertain.
Technical insights highlight a potential momentum shift as the MACD bullish crossover on the hourly chart aligns with the Bollinger Bands contracting, signaling a possible breakout. However, the daily chart emphasizes strong resistance between $105 and $110, which if surpassed, could confirm a new upward trend. The current triangle consolidation pattern suggests traders should watch for volume and price action that confirm breakout direction for high-probability trades.There are no significant or directly relevant economic events scheduled today that would impact WTI Crude Oil prices. Therefore, price movements will likely continue to be driven by geopolitical developments and technical factors.
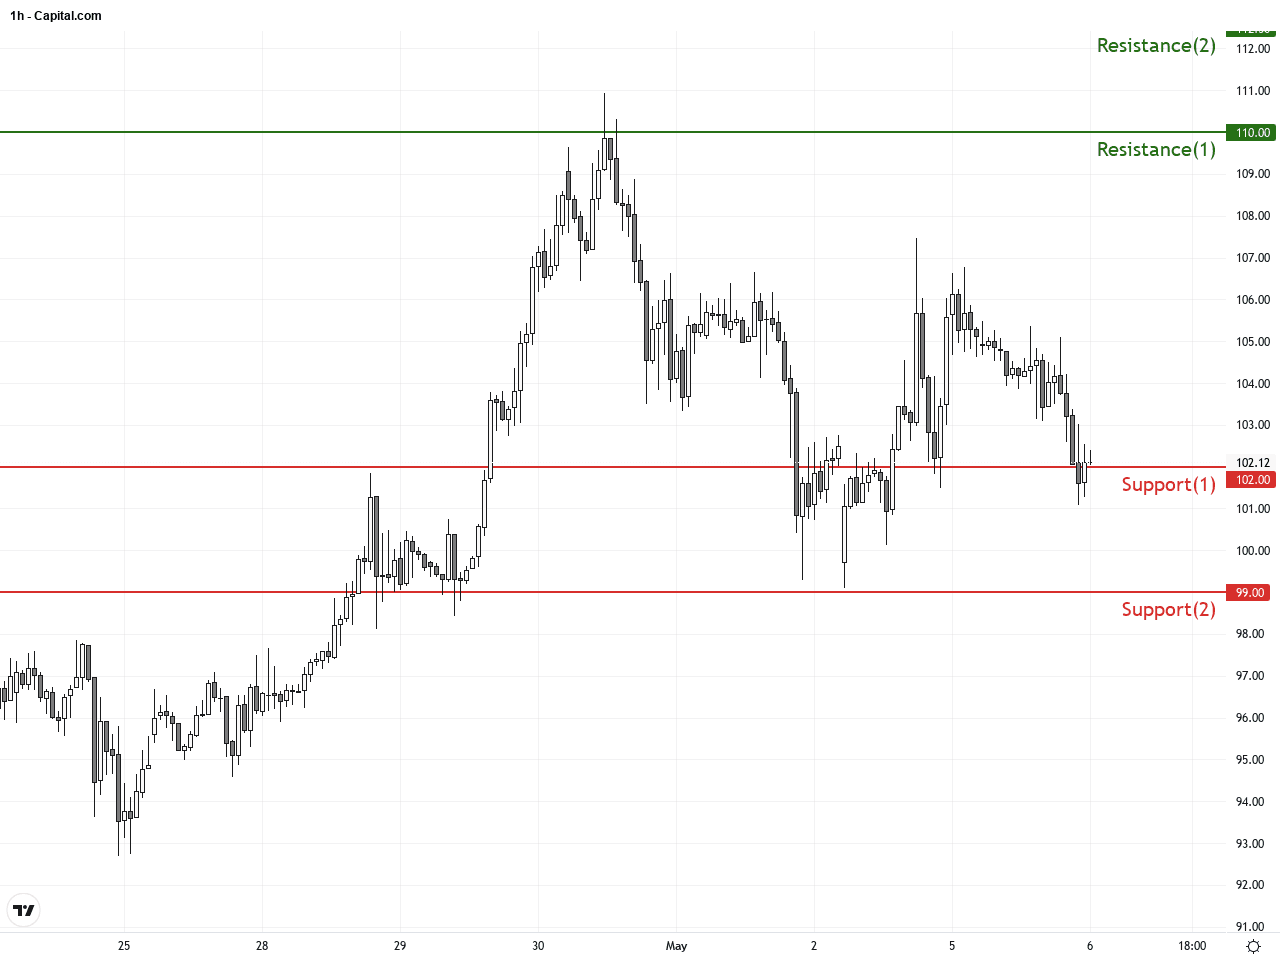
Resistance & Support
The above financial market data, quotes, charts, statistics, exchange rates, news, research, analysis, buy or sell ratings, financial education, and other information are for reference only. Before making any trades based on this information, you should consult independent professional advice to verify pricing data or obtain more detailed market information. 1uptick.com should not be regarded as soliciting any subscriber or visitor to execute any trade. You are solely responsible for all of your own trading decisions.