


 |
| Gold V.1.3.1 signal Telegram Channel (English) |

WTI Crude Oil: Surge Toward $105 on Iran War Supply Concerns Boosts Trading Outlook, May 19, 2026
2026-05-19 @ 06:03
Over the past 24 to 48 hours, WTI Crude Oil prices surged significantly, opening at around $101.74 and climbing to close to $108 per barrel, marking nearly a 3% increase from yesterday’s closing price of $104.38. This rally was mainly driven by fresh concerns over supply disruptions stemming from the Iran conflict, with markets highly sensitive to escalating tensions in the Middle East. Coupled with new US sanctions against Iran, the risk to oil supply has heightened, fueling bullish momentum.
Additionally, energy-related stocks such as Seadrill, ProPetro, NOV, and Calumet saw strong gains as crude oil reclaimed the $100 per barrel threshold, indicating enhanced investor confidence in the energy sector. Although former President Trump postponed a planned attack on Iran, the market remains cautious, anticipating a potential prolonged closure of the Strait of Hormuz, which could further tighten supply and push prices higher.
For the average investor, this geopolitical volatility transforms crude oil into a sought-after hedging asset but also means increased price swings. Simply put, the recent strength in the oil market is a direct consequence of intensifying US-Iran tensions and the associated risks of supply disruption. This dynamic has propelled oil to a two-week high and is likely to keep the market on edge in the coming days.

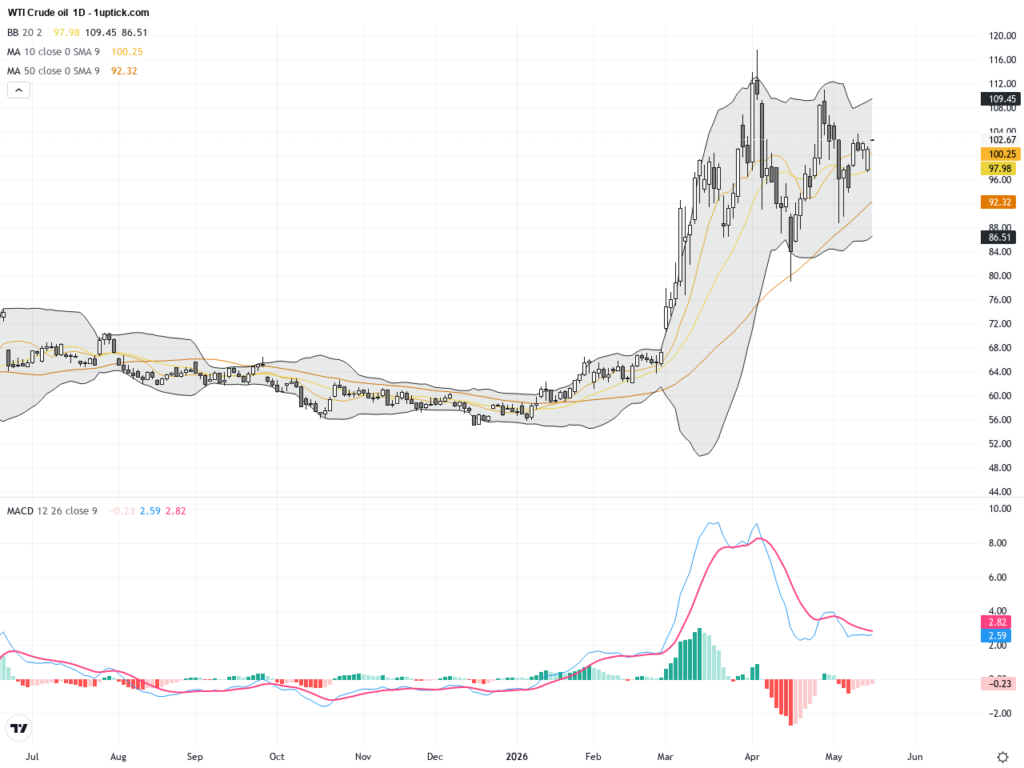
The daily chart shows WTI Crude Oil trending upward since early May, rising from around $95 to recently breaking above the $100 level multiple times. The Bollinger Bands have expanded, indicating increased volatility. A bullish crossover (golden cross) between the 20-day and 50-day moving averages confirms a sustained bullish trend. The MACD remains in positive territory, signaling strong buying momentum on a medium to long-term basis.
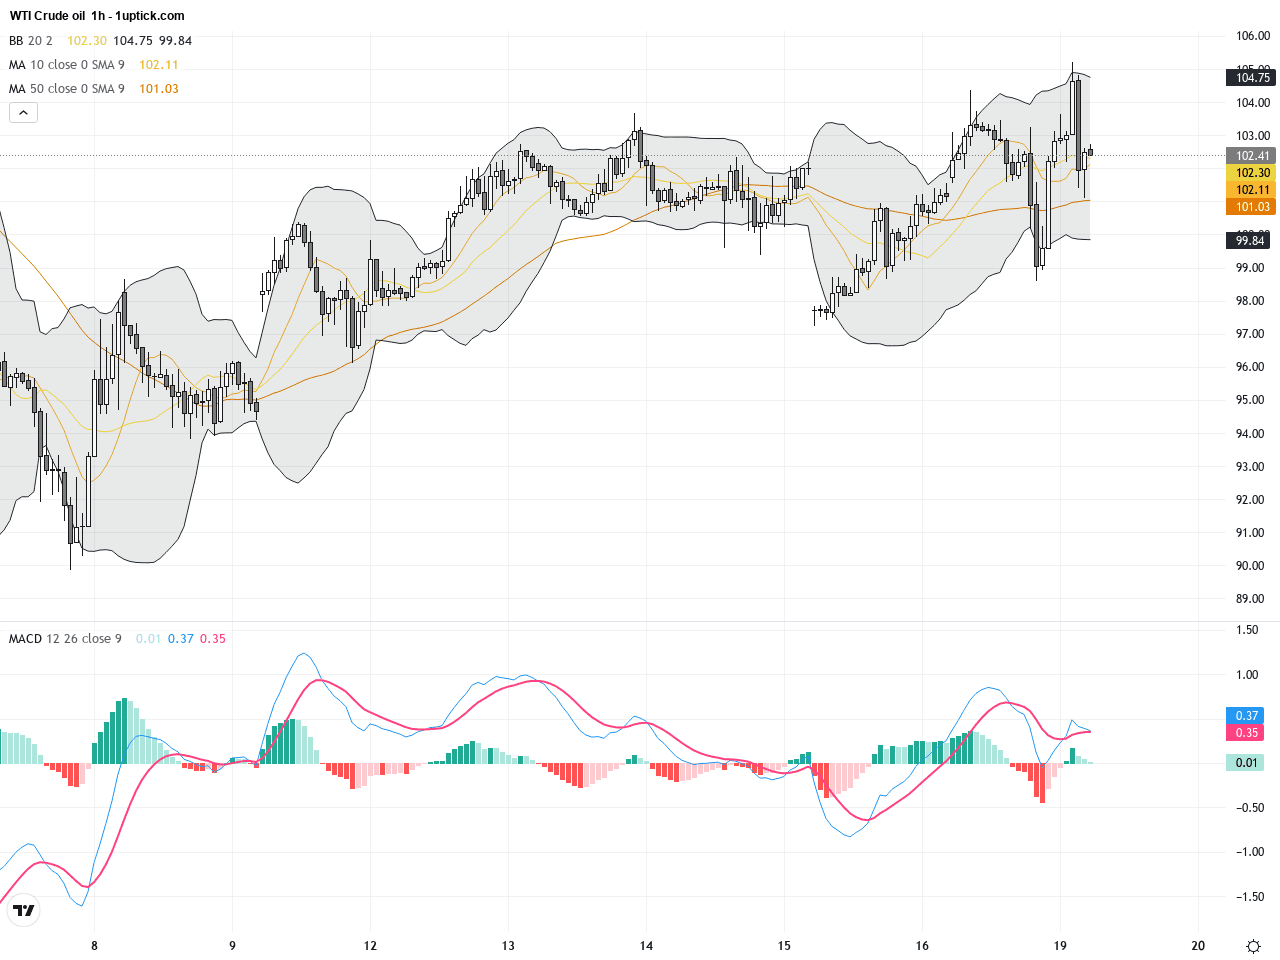
The hourly chart over the past 3-5 days reveals volatility between roughly $98 and $105. Recent price action formed a bullish flag consolidation pattern around the $103-104 range, suggesting potential continuation of the upward trend once the breakout occurs. The MACD histogram is expanding, with the fast line above the slow line, pointing to strong short-term momentum. Bollinger Bands show price repeatedly testing the upper band without a decisive breakout, indicating a possible imminent directional move.
Technical Trend: Currently, WTI Crude Oil is in a decisively bullish trend, supported by volume and momentum indicators signaling further upward price action.
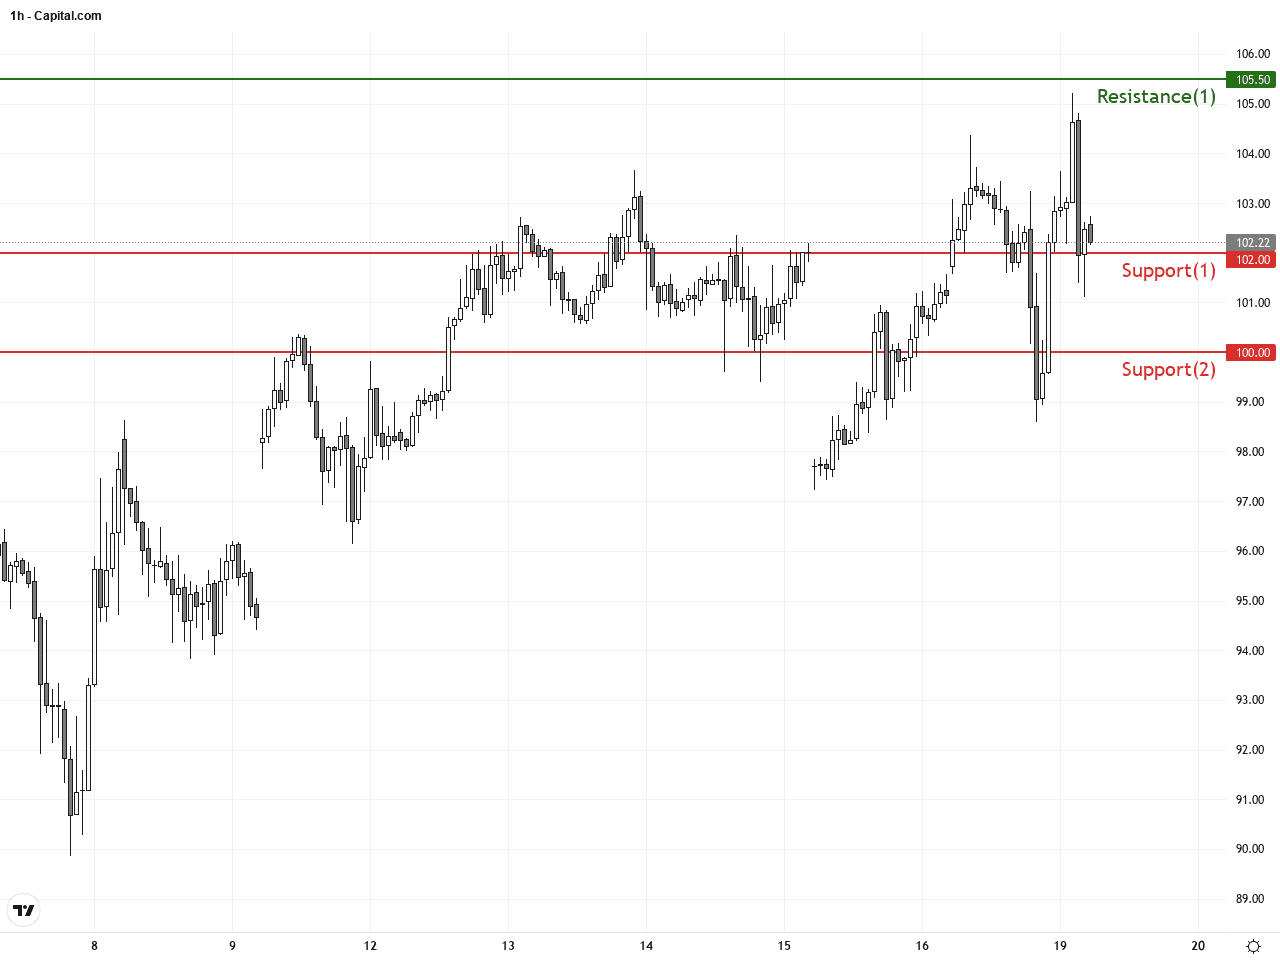
WTI Crude Oil is trading within critical support and resistance zones but maintains a technical edge favoring the bulls. The golden cross and strong MACD momentum provide confidence for continued upside potential. The formed bullish flag pattern indicates a likely breakout direction soon. Market sentiment remains sensitive to geopolitical developments surrounding Iran, recommending close attention to news flow.There are no significant or directly relevant economic events scheduled today that would impact WTI Crude Oil prices. Current price movements remain primarily influenced by geopolitical developments and supply-demand expectations.
Resistance & Support
The above financial market data, quotes, charts, statistics, exchange rates, news, research, analysis, buy or sell ratings, financial education, and other information are for reference only. Before making any trades based on this information, you should consult independent professional advice to verify pricing data or obtain more detailed market information. 1uptick.com should not be regarded as soliciting any subscriber or visitor to execute any trade. You are solely responsible for all of your own trading decisions.