


 |
| Gold V.1.3.1 signal Telegram Channel (English) |

XAUUSD Gold Analysis: Caution Amid Fed Rate Hike Fears and Critical Support Levels, May 19, 2026
2026-05-19 @ 05:04
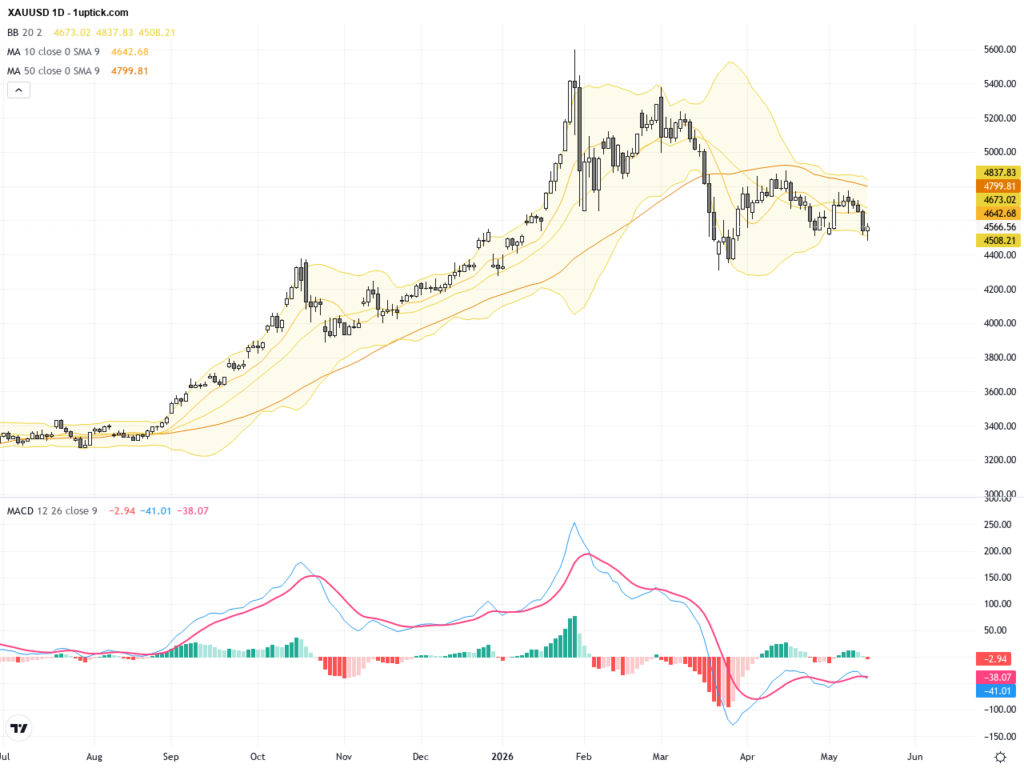
Over the past 24 to 48 hours, the gold (XAUUSD) market has remained relatively steady, with the closing price yesterday at $4564 per ounce, reflecting a period of volatility stabilizing around a mid-range level. The market has been primarily influenced by concerns over potential Federal Reserve interest rate hikes, causing investors to switch between safe-haven assets, which helped gold maintain resilience.
According to the latest market news, fears about faster Fed rate hikes have strengthened the US dollar and increased US Treasury yields, both of which typically pressure gold prices downward. However, geopolitical tensions near the Strait of Hormuz have elevated demand for oil and safe-haven assets, partially offsetting the downward pressure on gold and helping keep prices stable.
For the average investor, the recent gold price fluctuation is a reflection of growing global economic uncertainty, especially amid high inflation and differing central bank policy signals. Investors in gold should closely monitor macroeconomic data and international political developments, as these factors directly affect gold’s appeal as a safe haven and its price dynamics.
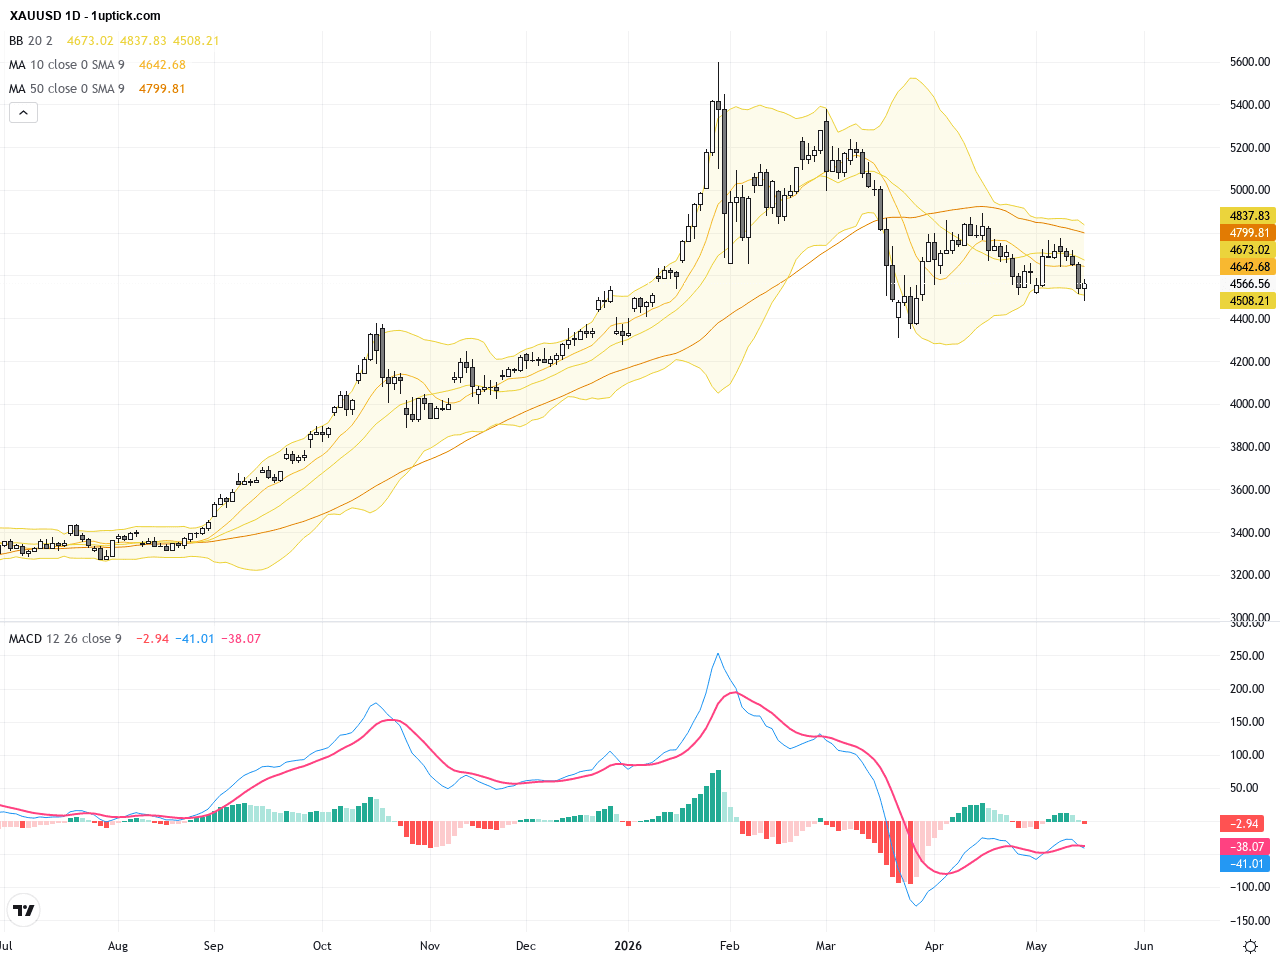
The daily chart shows XAUUSD in a downward oscillating trend over the past week, declining from around 4700 to approximately 4564. Bollinger Bands depict price nearing the lower band with a tightening range, hinting at reduced volatility. The MACD is approaching a bearish crossover, suggesting the downtrend may continue in the near term. Moving averages are aligned bearishly, signaling potential further downside risks.
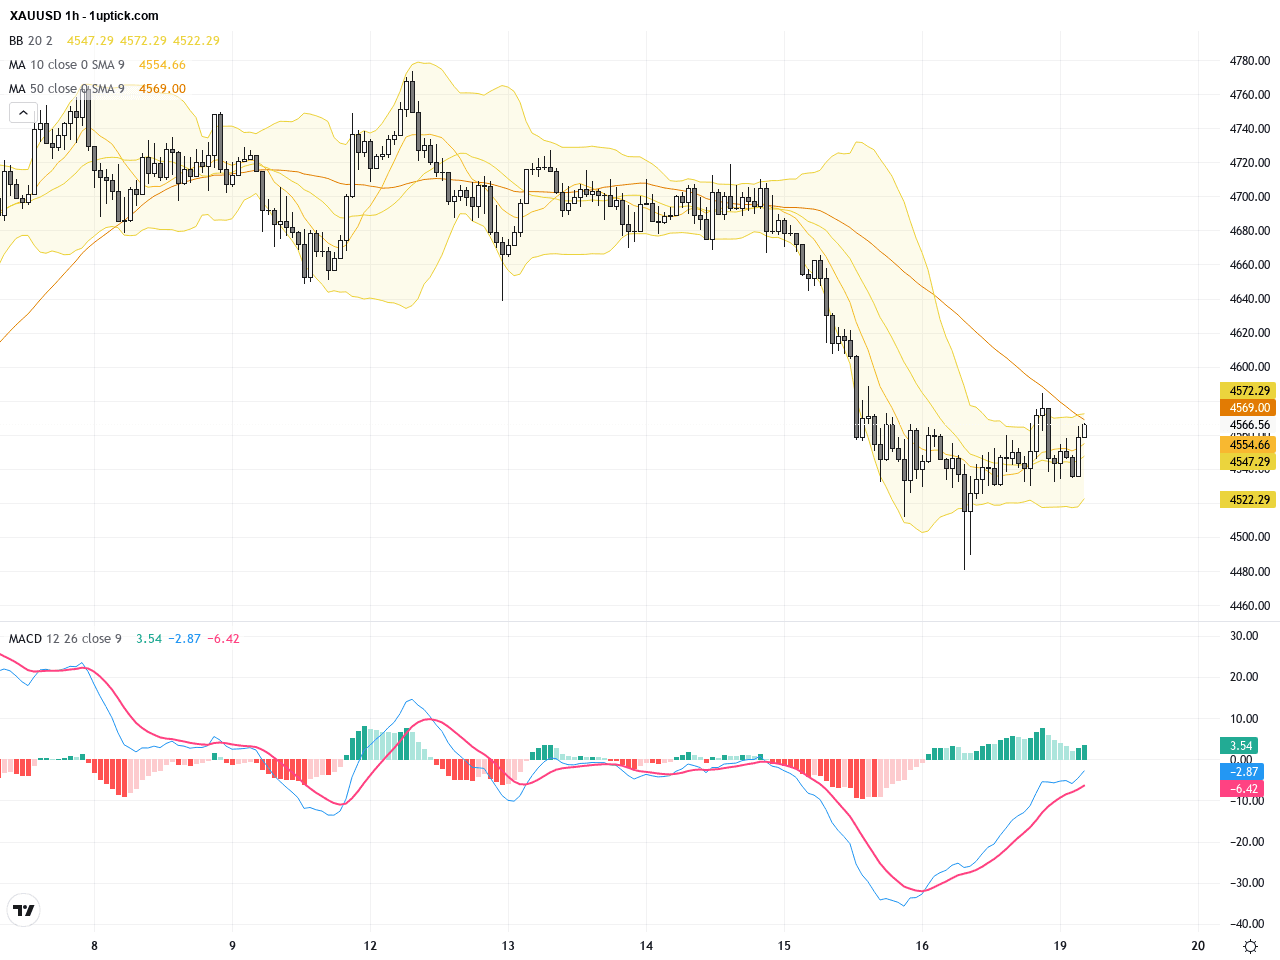
In the hourly chart covering the last 3-5 days, XAUUSD has repeatedly tested the 4550 support level without a clear breakdown, forming a consolidation zone. Short-term moving averages (such as 20 EMA and 50 EMA) are intertwined, reflecting market indecision. The MACD histogram shows diminishing momentum, and RSI is not yet in oversold territory, indicating possible sideways movement. A recent bearish engulfing candlestick pattern suggests near-term pressure is likely to persist in the next 24 hours.
Technical Trend: The current short-term trend is cautiously bearish with oscillating weakness.
Technically, XAUUSD faces evident downward pressure with the daily MACD nearing a bearish crossover, reinforcing the short-term downtrend. The hourly chart’s bearish engulfing pattern warns of continued short-term weakness. Volume remains relatively steady, suggesting a balance in supply and demand, yet the overall cautious investor stance in light of Fed rate hike fears and a strong dollar biases gold lower. Breach of key support levels would confirm further bearish momentum, while resilient support could lead to sideways or rebound action.Today’s GMT+1 economic calendar highlights the US NAHB Housing Market Index release at 16:00, forecasted at 37, slightly above the prior 34, indicating a modestly stronger housing sector. This data may strengthen the USD and exert further downward pressure on gold prices. No other major events directly impact XAUUSD today, so traders should focus on broader US macroeconomic factors and geopolitical developments to anticipate gold price moves.
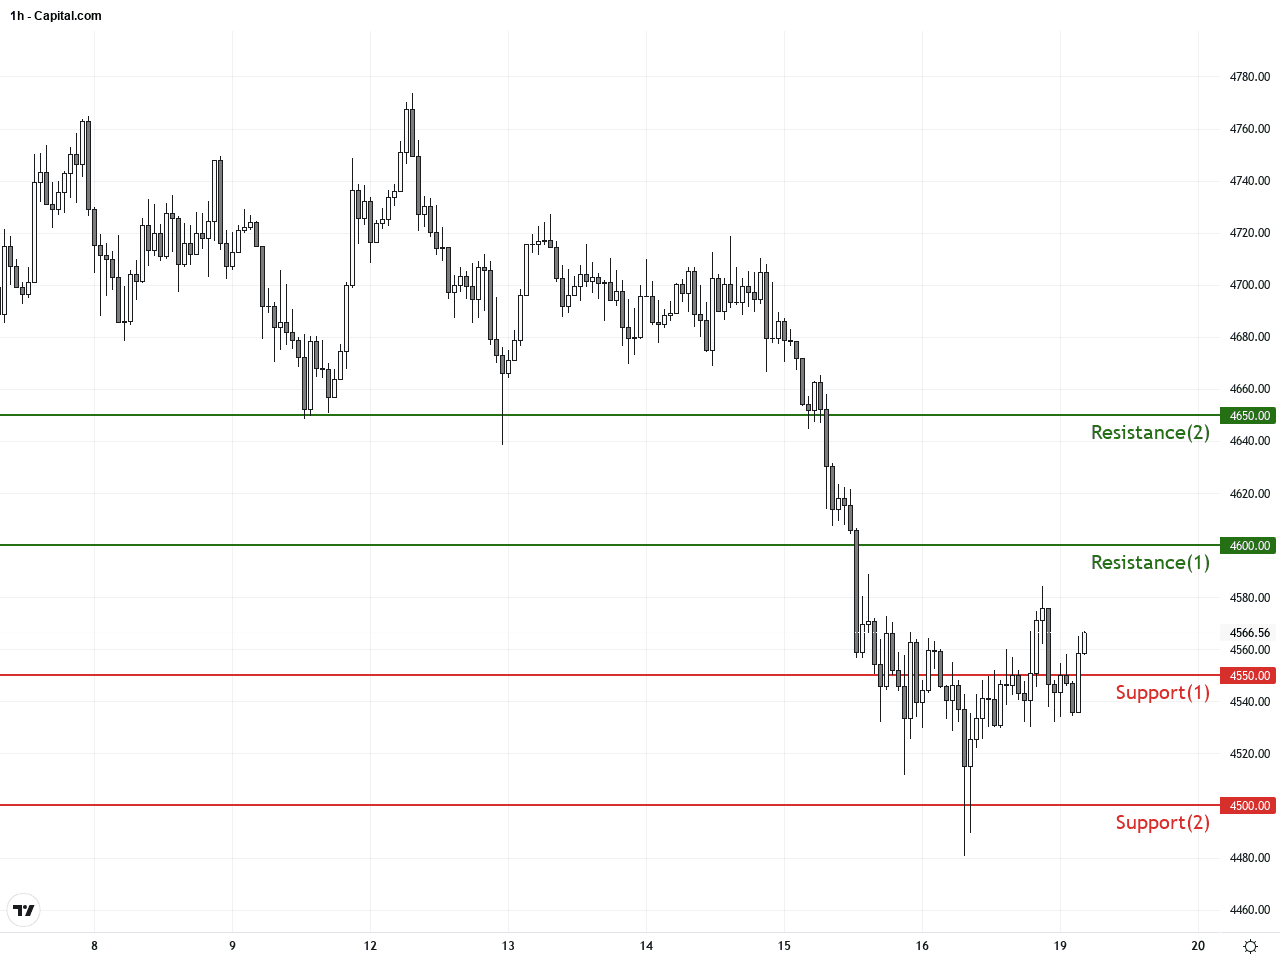
Resistance & Support
The above financial market data, quotes, charts, statistics, exchange rates, news, research, analysis, buy or sell ratings, financial education, and other information are for reference only. Before making any trades based on this information, you should consult independent professional advice to verify pricing data or obtain more detailed market information. 1uptick.com should not be regarded as soliciting any subscriber or visitor to execute any trade. You are solely responsible for all of your own trading decisions.