


 |
| Gold V.1.3.1 signal Telegram Channel (English) |
XAUUSD Gold Price Analysis: Facing Strong Resistance at Key Moving Averages, Trading Outlook and Critical Levels, May 14, 2026
2026-05-14 @ 05:04
Over the past 24 to 48 hours, the gold (XAUUSD) market has experienced notable volatility. On May 13, 2026, gold closed at $4,689.31, dropping around $26 from the previous day, reflecting investors’ cautious adjustments amid ongoing risk-off sentiment and market uncertainty.
According to the latest market news, silver has continued its rally, reaching new highs that pushed the gold/silver ratio down toward the 53.00 level. This indicates stronger investor interest in silver compared to gold recently. Amid persistent geopolitical tensions, gold prices faced pressure due to a stronger US dollar and rising oil prices, reflecting ongoing concerns about the Federal Reserve’s future rate hike path. Additionally, mid-May US inflation data dampened expectations for a June rate cut, adding to the downward pressure on gold.
For the average investor, this means gold could face short-term price corrections, especially with the dollar rallying and tech stocks sliding on hot inflation reports. However, geopolitical risks continue to buoy demand for gold as a safe haven, meaning the market can swing sharply should the situation evolve. Understanding these fundamental drivers can help investors make more informed asset allocation decisions in a complex and shifting environment.

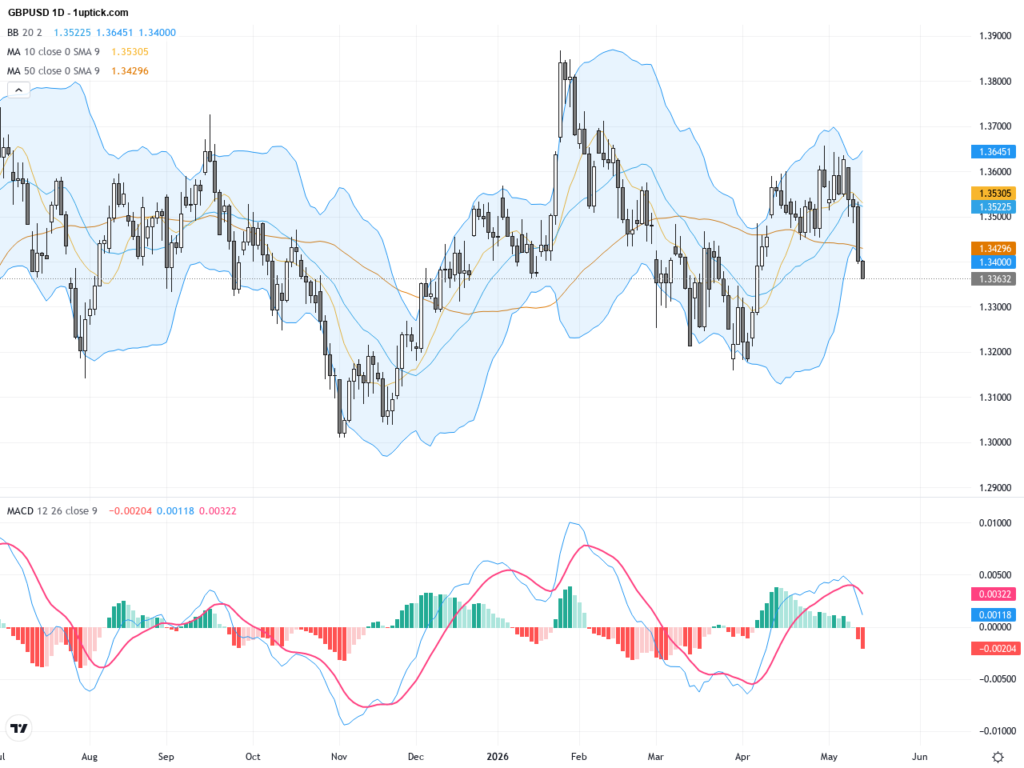
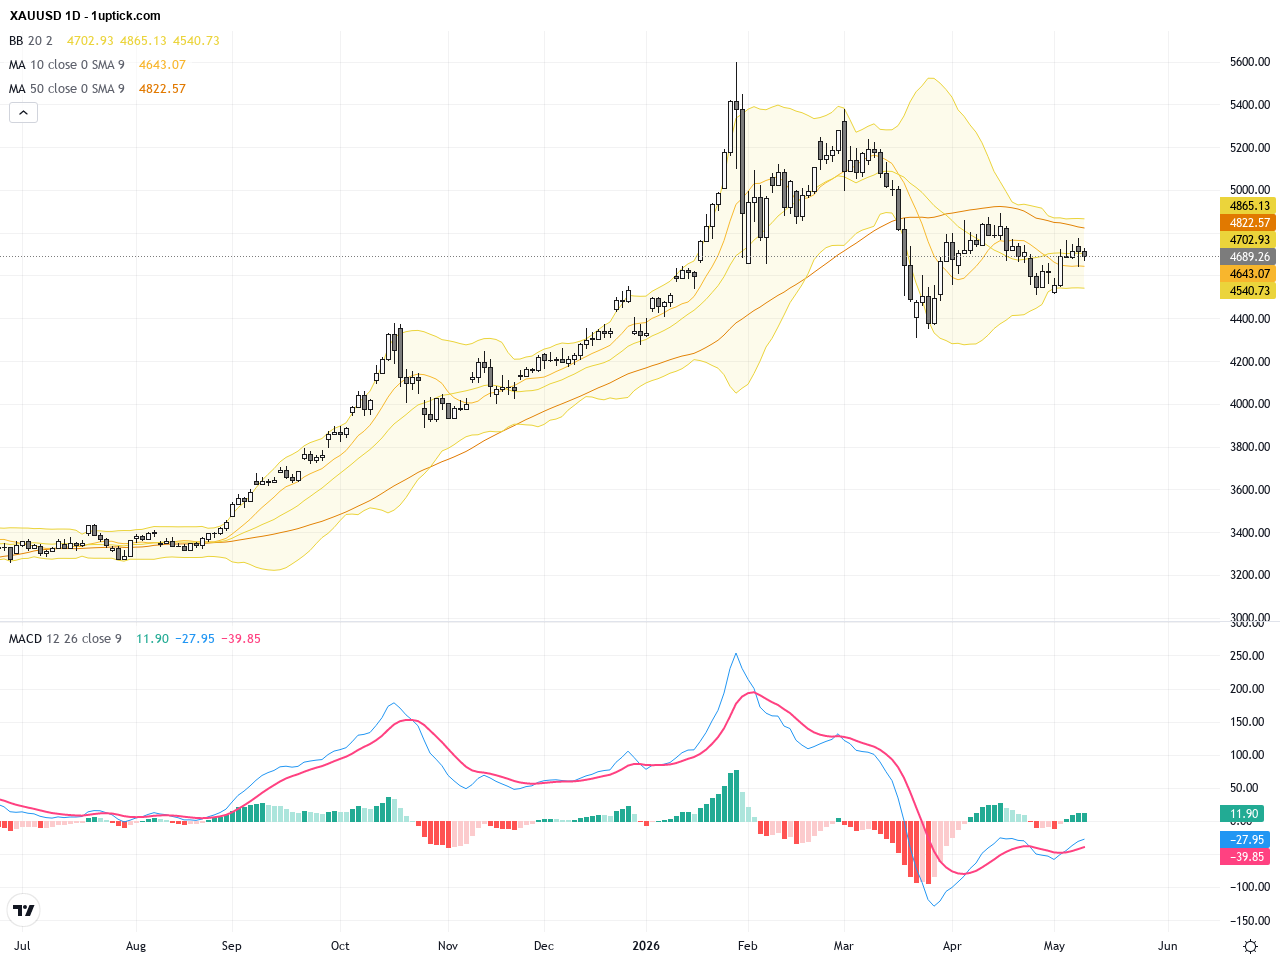
The daily chart shows XAUUSD maintaining a bullish consolidation pattern, with prices retreating from a recent high near 4735 to form a high-level trading range. The 20-day and 50-day simple moving averages (SMA) form a clear resistance zone where gold repeatedly faces rejection, indicating a battle between buyers and sellers. The MACD lines are nearly parallel, reflecting weak momentum without strong selling pressure. Bollinger Bands are narrowing, suggesting increased short-term uncertainty. The overall trend remains skewed upward but is vulnerable to a technical correction.
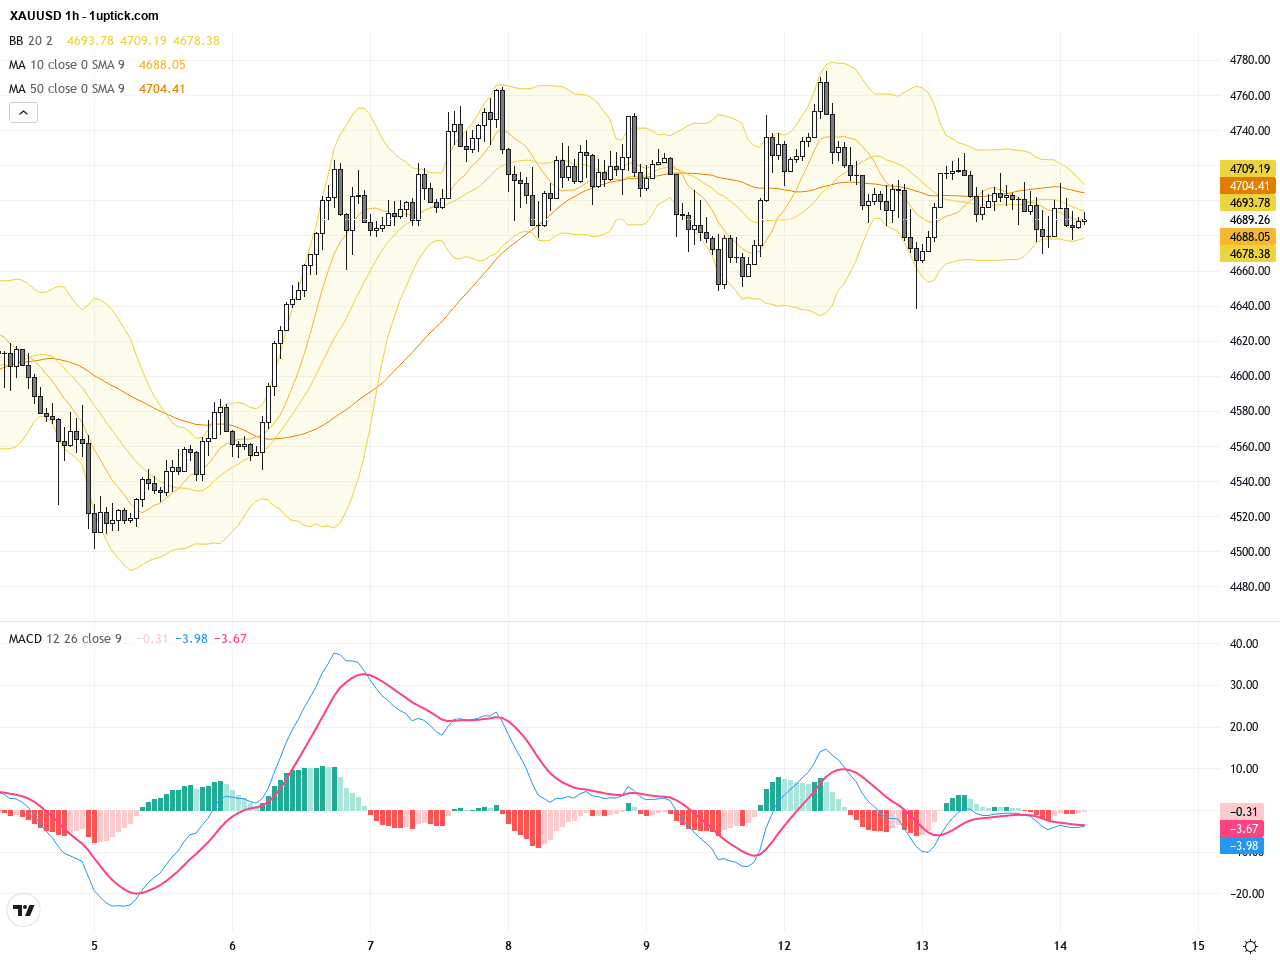
The hourly chart over the last 3-5 days reveals a breakout attempt above multiple moving averages earlier, followed by a sharp pullback as gold encounters resistance between the 20-day and 50-day moving averages. Candlesticks show long upper wicks signaling heavy selling pressure at higher levels. The MACD has formed a bearish crossover, indicating weakening momentum, while RSI is near neutral but slightly bearish. A recent doji candle reflects market indecision, hinting at possible sideways consolidation in the next 24 hours within support and resistance bounds.
Technical Trend: Cautiously consolidating in a range-bound tug-of-war
Technically, XAUUSD faces a dual resistance challenge at its 20-day and 50-day moving averages, suggesting short-term upside momentum may falter. The MACD bearish crossover and neutral-to-bearish RSI indicate waning bullish strength. Bollinger Bands tightening on the daily chart point to shrinking volatility, though sudden news can trigger a breakout. The recent doji candlestick signals near-term consolidation, highlighting the importance of watching U.S. CPI data and geopolitical risks for directional cues.Today’s economic calendar features key data including Japan’s significantly better-than-expected March current account figures, Australia’s Q1 Wage Price Index in line with forecasts, and crucial U.S. Producer Price Index (PPI) and Core PPI releases at 14:30 GMT+1. Given XAUUSD’s sensitivity to USD strength and inflation data, a higher-than-expected PPI could bolster the dollar and pressure gold prices, while weaker data may provide relief for gold buyers. Other European and Middle Eastern events have limited direct impact, with the market’s focus centered on U.S. inflation and geopolitical developments.
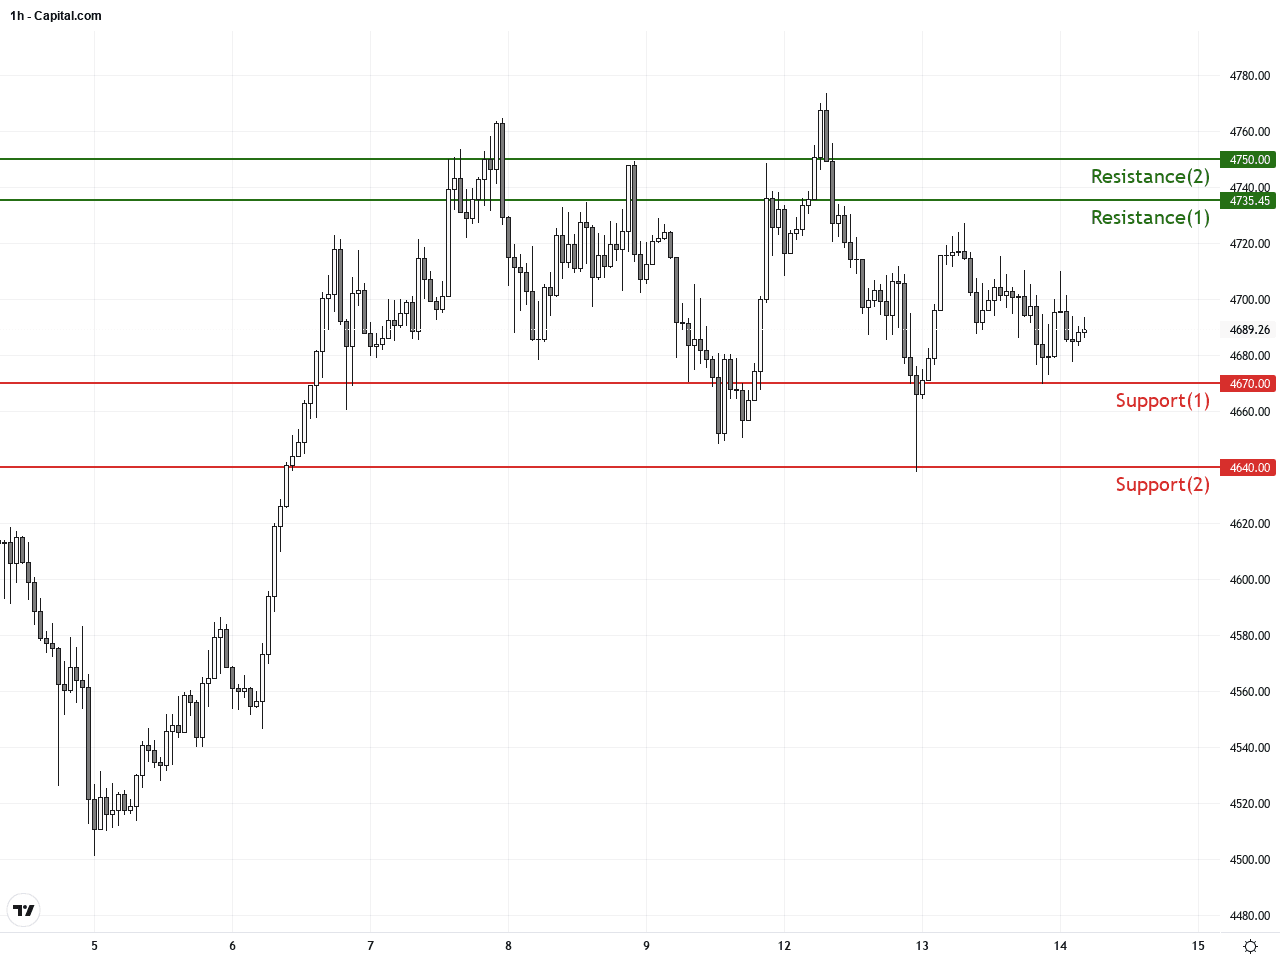
Resistance & Support
The above financial market data, quotes, charts, statistics, exchange rates, news, research, analysis, buy or sell ratings, financial education, and other information are for reference only. Before making any trades based on this information, you should consult independent professional advice to verify pricing data or obtain more detailed market information. 1uptick.com should not be regarded as soliciting any subscriber or visitor to execute any trade. You are solely responsible for all of your own trading decisions.