









 |
| Gold V.1.3.1 signal Telegram Channel (English) |
XAUUSD Gold: Technical Correction Near Key Support Ahead of Crucial US Payroll Data, August 4, 2026
2026-08-04 @ 05:04
Over the past 24 to 48 hours, gold (XAUUSD) has experienced notable volatility, with prices slightly retreating from yesterday’s closing price of 4056.34 USD. The recent plunge in oil prices eased inflationary pressures, providing some support for gold and stabilizing market sentiment. However, as traders shift their focus to the upcoming US non-farm payroll data, gold prices have seen fluctuating movement. Market participants widely anticipate that a strong employment report may intensify Federal Reserve rate hike expectations, putting downward pressure on gold.
Recent market news highlights gold’s cautious pause ahead of the payroll release, with oil’s decline offering short-term relief but not altering fundamental rate-driven dynamics behind gold prices. Additionally, there are emerging perspectives positioning gold in the early stages of a long-term bull market, garnering interest from medium-to-long term investors. Overall, the recent price swings stem from macroeconomic data anticipation and adjustments in inflation outlook tied to oil prices, leading to diverging views on gold’s safe-haven role.
For the average investor, gold’s price action over this period resembles waiting for a major economic report: a strong payroll figure could accelerate Fed tightening, weighing on gold in the short run; conversely, weak jobs data might bolster gold prices. Investors should therefore closely monitor the imminent payroll release alongside oil price trends to stay attuned to gold’s evolving market narrative.
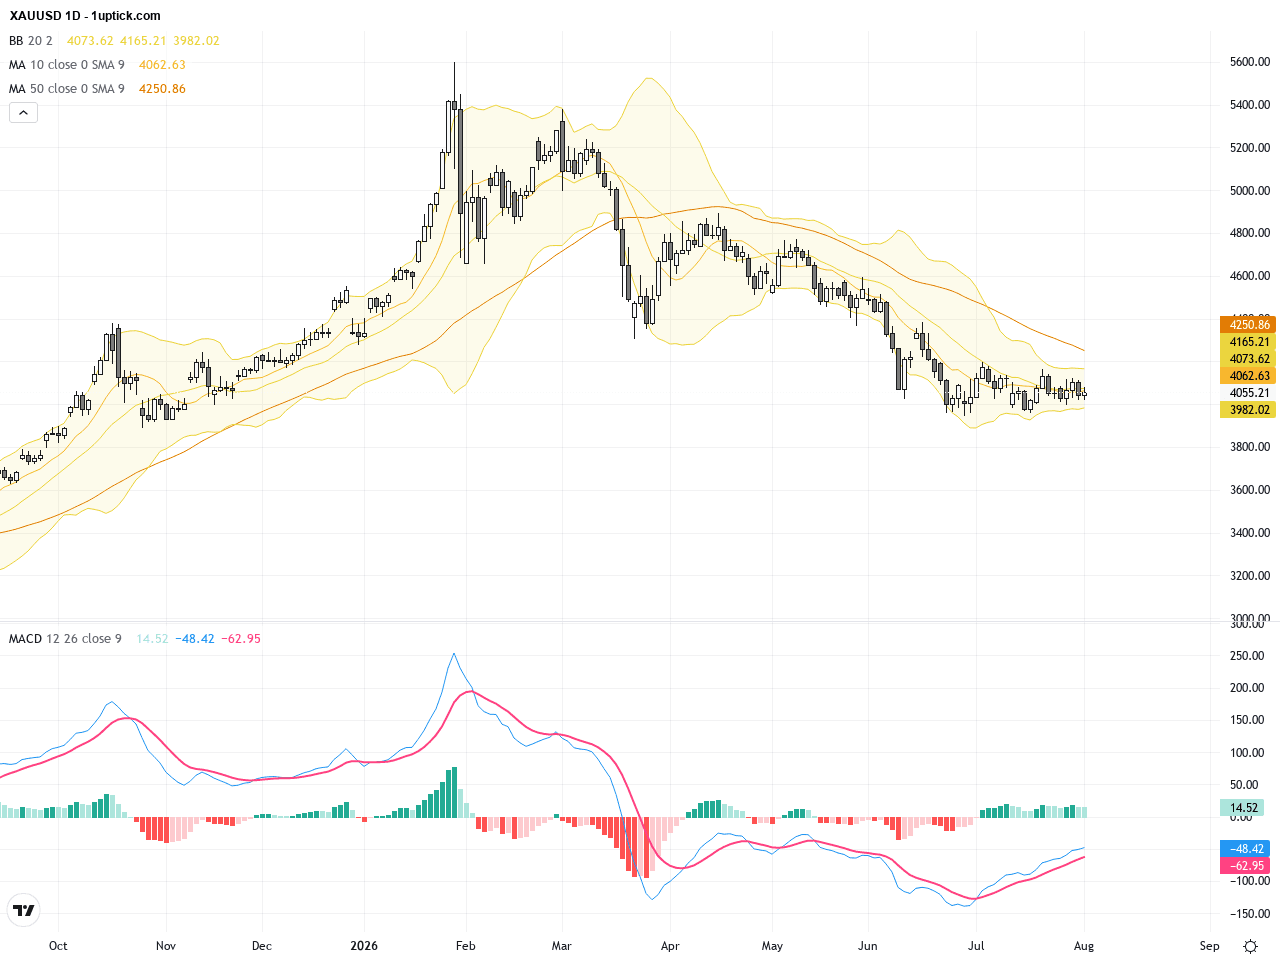
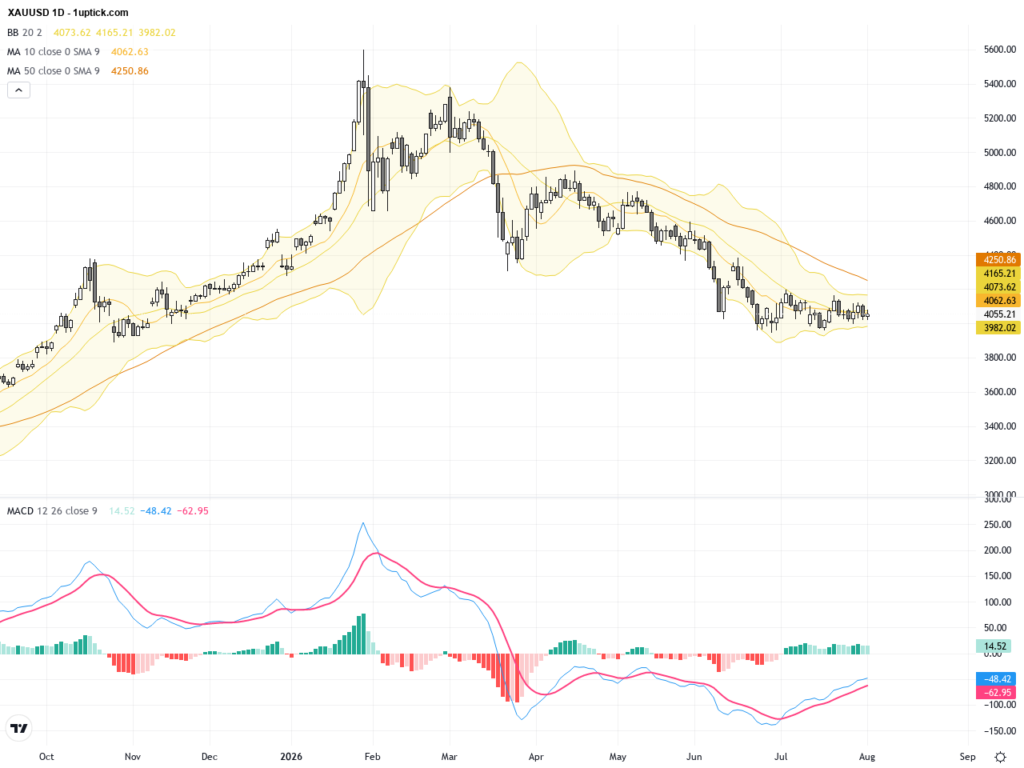
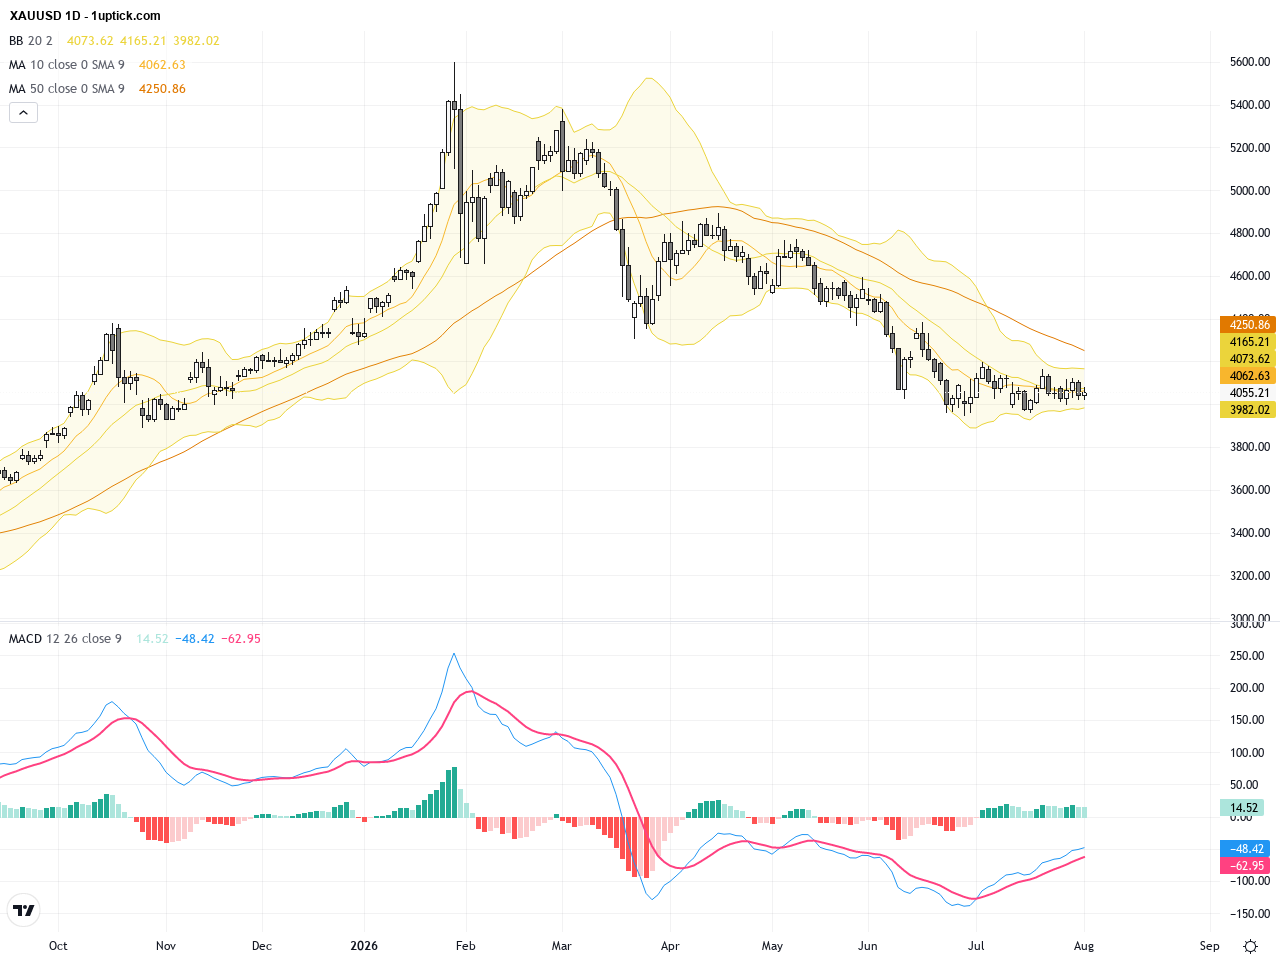
The daily chart reveals a corrective pullback from the recent high near $4200 down to around $4050 over the past week, indicating a phase of adjustment. The 200-day moving average offers strong support below. The Bollinger Bands show widened volatility but no clear breakdown below the lower band. The MACD remains near the zero line without a decisive trend shift, reflecting market uncertainty. Technically, gold is consolidating and may form a double bottom pattern or continue sideways until fresh bullish or bearish triggers emerge.
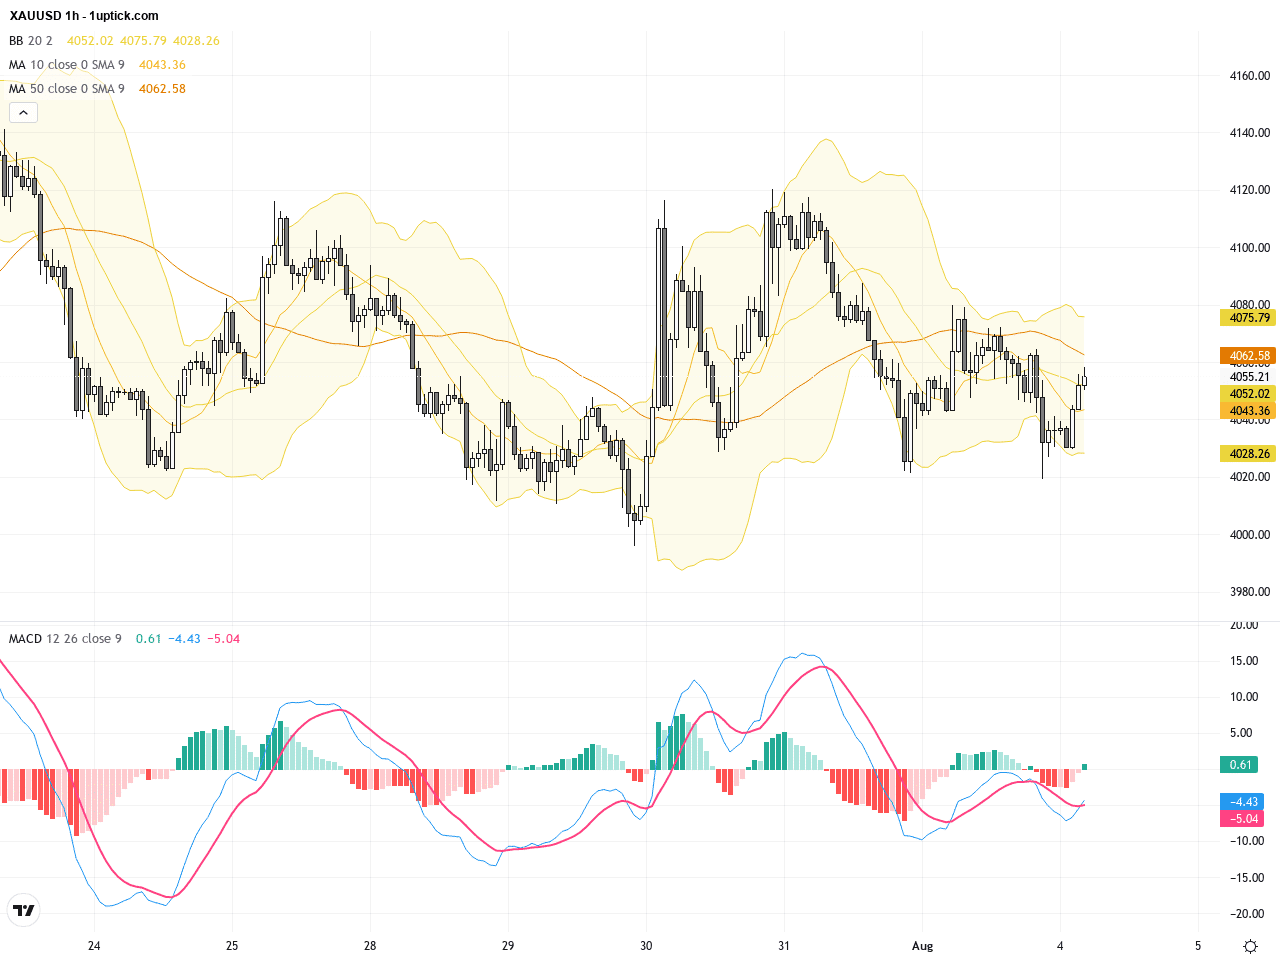
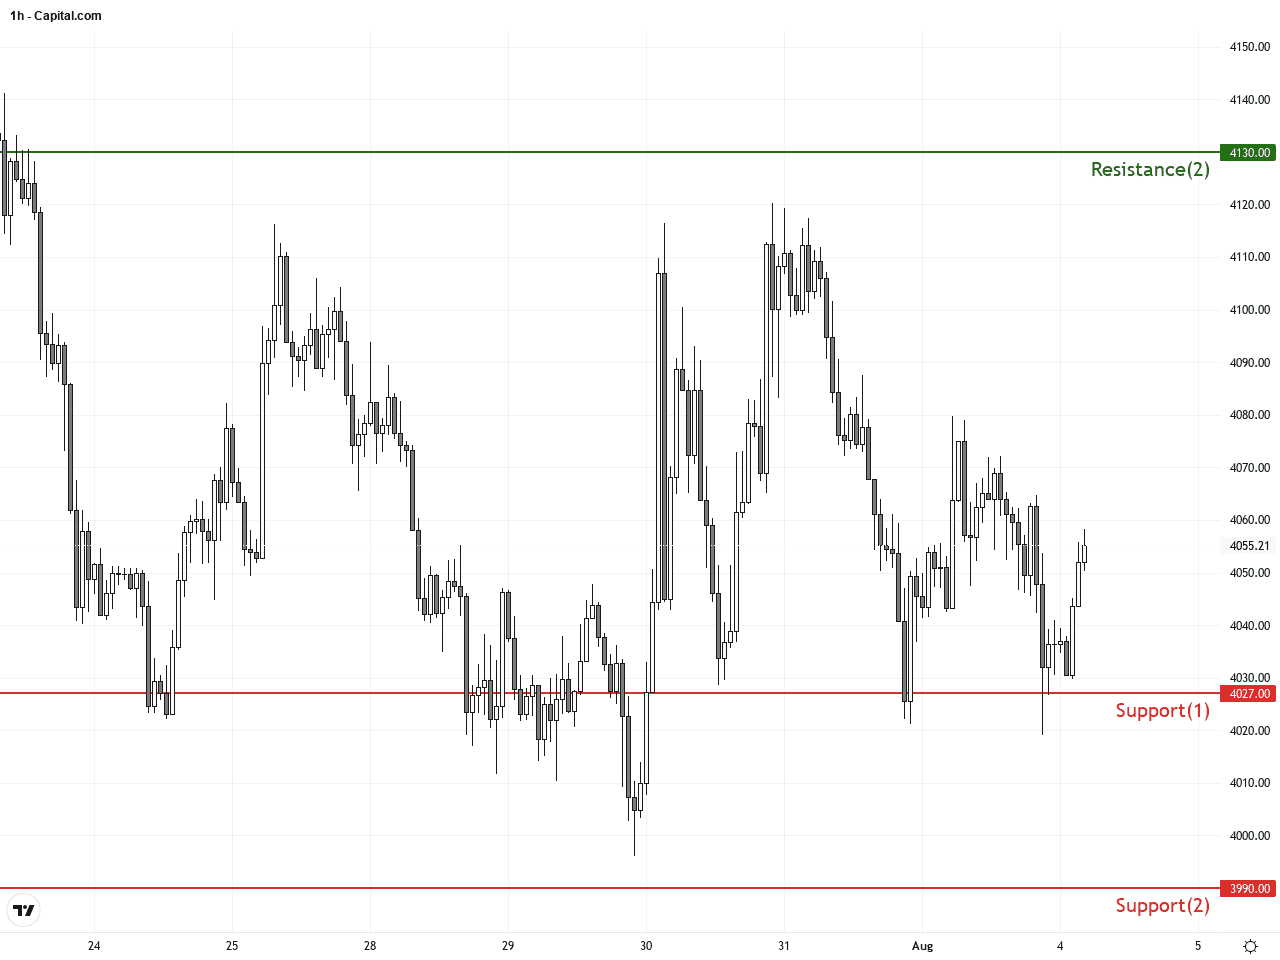
The hourly chart for the last 3-5 days shows XAUUSD oscillating between $4060 and $4027 support, with moving averages crossing back and forth. The MACD recently formed a bullish crossover near its lows, signaling potential short-term momentum shift to the upside. The Bollinger Bands are narrowing with some upward pressure. Most notably, a bullish engulfing candlestick pattern appeared on the 4-hour chart, suggesting a possible rebound in the next 24 hours. Traders should watch how price reacts at current support levels for confirmation.
Technical Trend: Cautiously Sideways
Technically, XAUUSD remains in a cautious consolidation phase with Bollinger Bands contraction and a recent MACD bottom crossover suggesting an imminent momentum shift. The price correction on the daily chart fits a typical retracement, while the 4-hour bullish engulfing candlestick pattern signals a potential short-term rebound. Market participants should closely monitor the upcoming US ISM data releases, as they represent a pivotal catalyst that could clarify the near-term trend.Today’s GMT+1 economic calendar highlights several manufacturing PMI releases across the globe, but the most relevant for XAUUSD is the US ISM Manufacturing Index, along with employment and new orders indices scheduled at 16:00 GMT+1. These reports will provide insight into US economic health and influence Fed monetary policy expectations. A stronger-than-expected ISM print could bolster the USD and pressure gold prices lower, while weaker data may support gold. Other European and Asian PMI data are unlikely to have direct impacts on XAUUSD today. No other significant events are expected to significantly move gold prices.
Resistance & Support
The above financial market data, quotes, charts, statistics, exchange rates, news, research, analysis, buy or sell ratings, financial education, and other information are for reference only. Before making any trades based on this information, you should consult independent professional advice to verify pricing data or obtain more detailed market information. 1uptick.com should not be regarded as soliciting any subscriber or visitor to execute any trade. You are solely responsible for all of your own trading decisions.