


 |
| Gold V.1.3.1 signal Telegram Channel (English) |
WTI Crude Oil: Key Support Holds as Middle East Tensions Drive Volatility, June 9, 2026
2026-06-09 @ 06:03
Over the past 24 to 48 hours, WTI crude oil has exhibited notable volatility, closing yesterday at $91.3, a drop from the prior days. Market sentiment was directly influenced by escalating tensions in the Middle East, notably the exchange of strikes between Israel and Iran over the weekend, which triggered a rapid price spike. Though both parties later announced a halt to further attacks, the geopolitical risk in the energy markets had already pushed oil prices higher in the short term.
According to the latest market news, oil prices initially surged due to the Israel-Iran conflict but pared gains after both sides ceased attacks. Additionally, the threat from Iran-backed Houthi forces blocking the Bab el-Mandeb strait in the Red Sea continues to inject uncertainty, keeping oil prices elevated. Such supply-side risks have investors cautious about the outlook for oil.
For the average investor, this price movement can be likened to a sudden traffic jam: the crude oil market is like a highway, while the Middle East tensions represent a blocked stretch causing a temporary delay in deliveries, thus driving up transportation costs—or in this case, oil prices. When attacks paused, the ‘traffic’ briefly improved, leading to some price pullback; however, ongoing risks nearby prevent a full return to normalcy. This volatility mirrors investors’ heightened alertness to geopolitical risks in the coming weeks, prompting a cautious stance in the market.
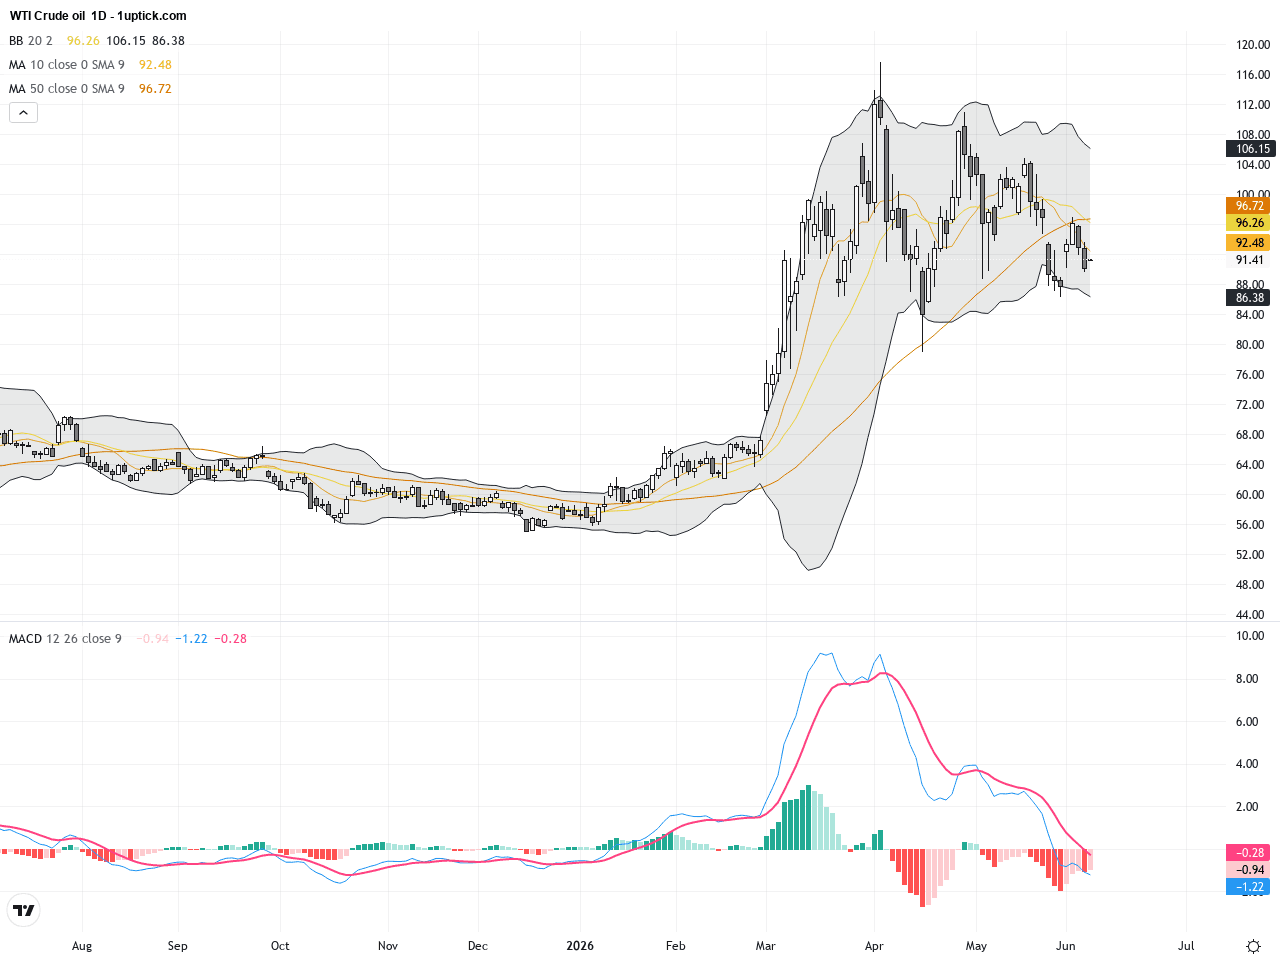
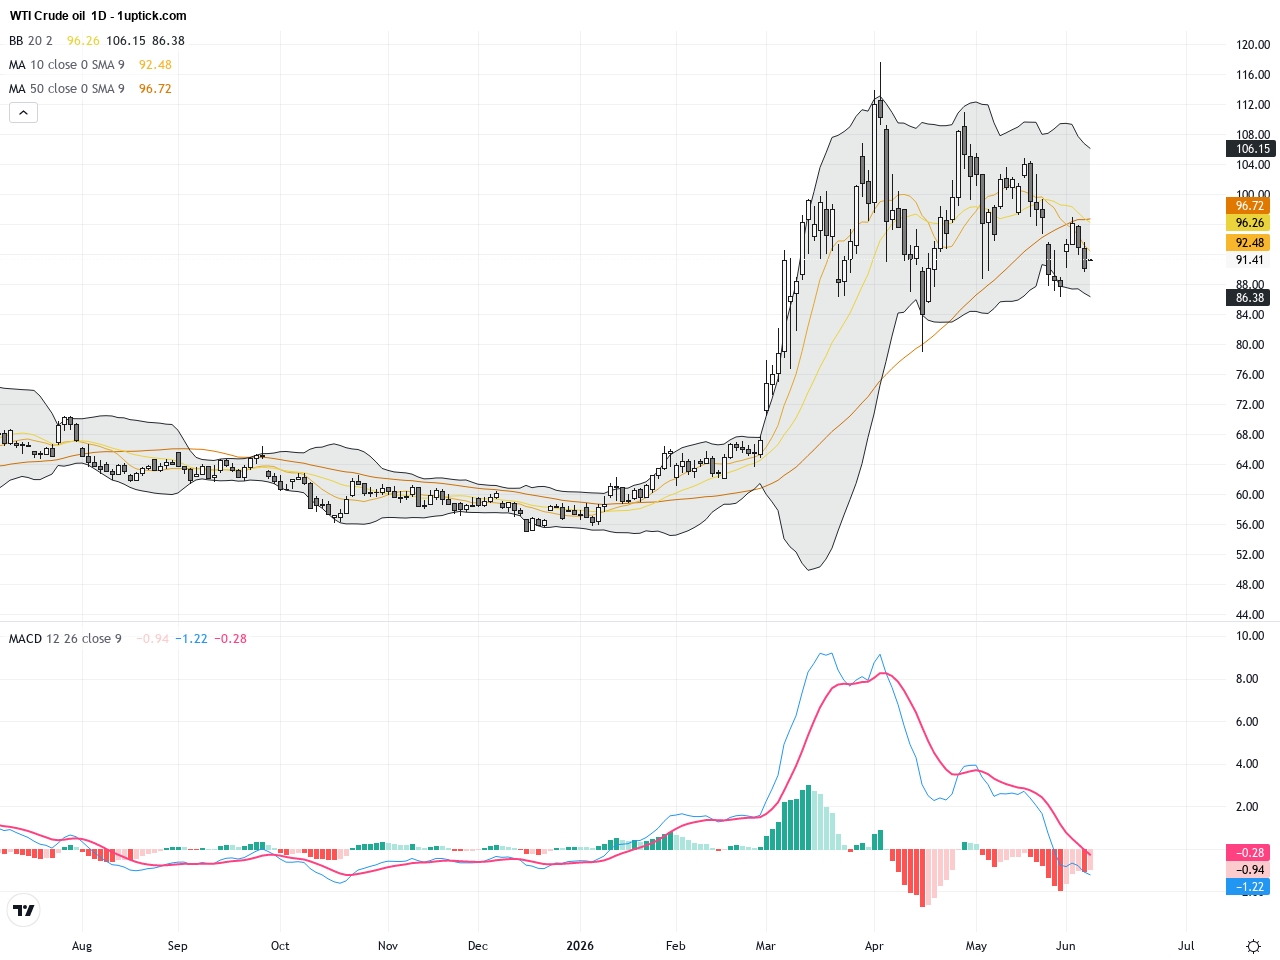
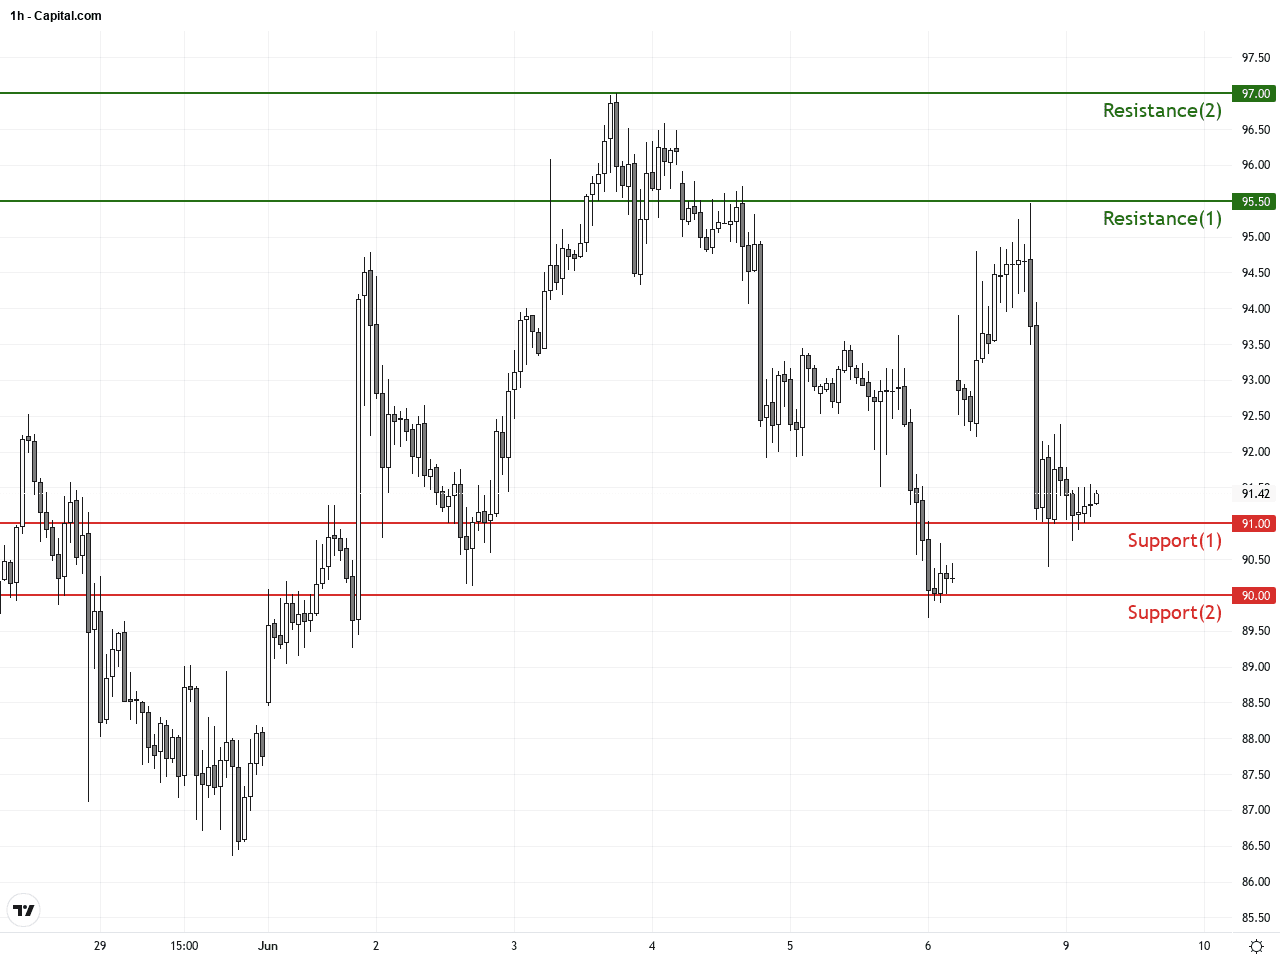
The WTI daily chart reveals a general downtrend since mid-May with multiple failed attempts to break above the $95 resistance level. Bollinger Bands are contracting, signaling a potential breakout as volatility consolidates. Daily MACD is in negative territory and showing mild bearish divergence, reflecting continued short-term bearish momentum. The price has repeatedly found support near the $91 level, a crucial technical floor. If the price breaks below this, a move towards the $90 level may ensue.
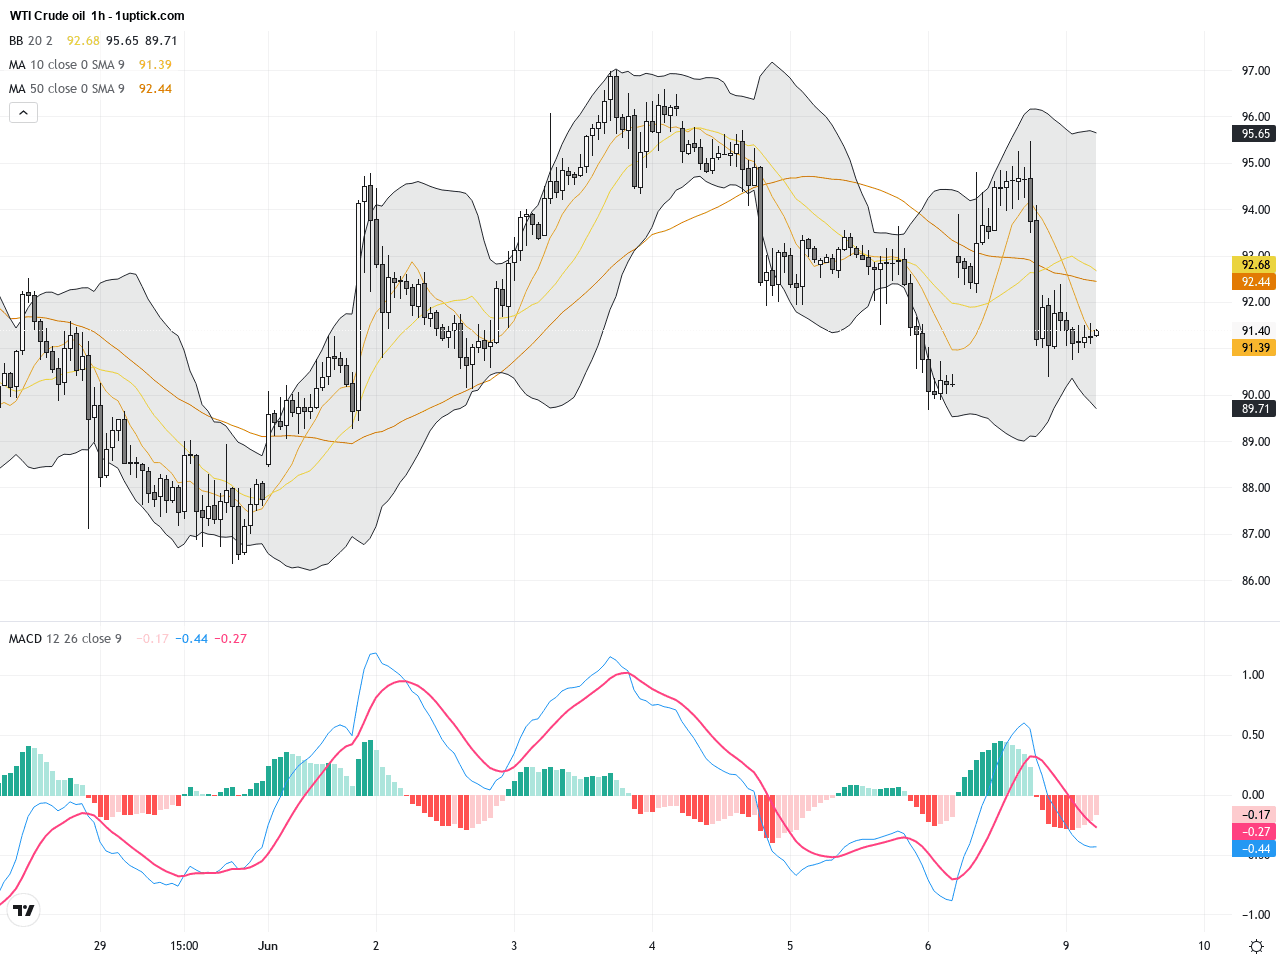
The last 3-5 days’ WTI hourly chart shows consolidation at a low range between $90 and $93 after last Friday’s drop. Short-term moving averages (20 and 50 EMA) are intertwined, indicating no clear trend direction. The MACD lines are poised for a crossover, while RSI hovers around 50, suggesting balanced momentum awaiting new catalysts. Pay close attention to the forming short-term triangle pattern, where a breakout could lead to significant price movement.
Technical Trend: WTI Crude Oil is currently in a cautiously sideways trend, with market sentiment fluctuating amid geopolitical uncertainties.
Technically, WTI Crude Oil is at a pivotal junction—while the daily chart trend remains bearish, short-term price action is range-bound between key support and resistance levels. An approaching MACD bullish crossover might hint at a rebound, but losing the $91 support could trigger accelerated declines. Traders should closely watch the $91 support and $95 resistance zones, while remaining alert to unexpected geopolitical news and U.S. dollar strength that may cause sudden price shifts.There are no significant economic releases scheduled today that would directly impact WTI Crude Oil prices. Market participants should continue to monitor geopolitical developments and U.S. economic data for cues affecting oil price volatility.
Resistance & Support
Run Live WTI Crude Oil Analysis
The above financial market data, quotes, charts, statistics, exchange rates, news, research, analysis, buy or sell ratings, financial education, and other information are for reference only. Before making any trades based on this information, you should consult independent professional advice to verify pricing data or obtain more detailed market information. 1uptick.com should not be regarded as soliciting any subscriber or visitor to execute any trade. You are solely responsible for all of your own trading decisions.