 |
| Gold V.1.3.1 signal Telegram Channel (English) |
XAUUSD: Gold Attempts Rebound After Sell-Off, Key Support and Resistance Levels Identified, June 9, 2026
2026-06-09 @ 05:04
Over the past 24 to 48 hours, gold (XAUUSD) has experienced notable volatility, with prices fluctuating around yesterday’s closing price of $4327.525. Market sentiment has been influenced by multiple factors, particularly strong U.S. employment data that have boosted expectations for Federal Reserve interest rate hikes, putting pressure on gold and pushing it down to a two-month low, breaking below the 200-day moving average.
Meanwhile, escalating tensions in the Middle East, with Iran’s attack on Israel, have raised geopolitical risks, driving oil prices higher and fueling inflation fears. Typically, such geopolitical risks support gold’s safe-haven appeal, but under the weight of higher rate hike expectations, gold has struggled to gain momentum, reflecting the market’s greater concern over rising interest rates putting pressure on gold’s yield appeal.
For the average investor, this market scenario could be likened to navigating through a storm: the thickening geopolitical tensions increase safe-haven demand, but concurrently, a strong U.S. economy implies rising interest rates. This dual dynamic makes gold’s price action uncertain. Investors should closely watch upcoming Consumer Price Index (CPI) and Producer Price Index (PPI) releases, as these will be critical in determining gold’s near-term direction.

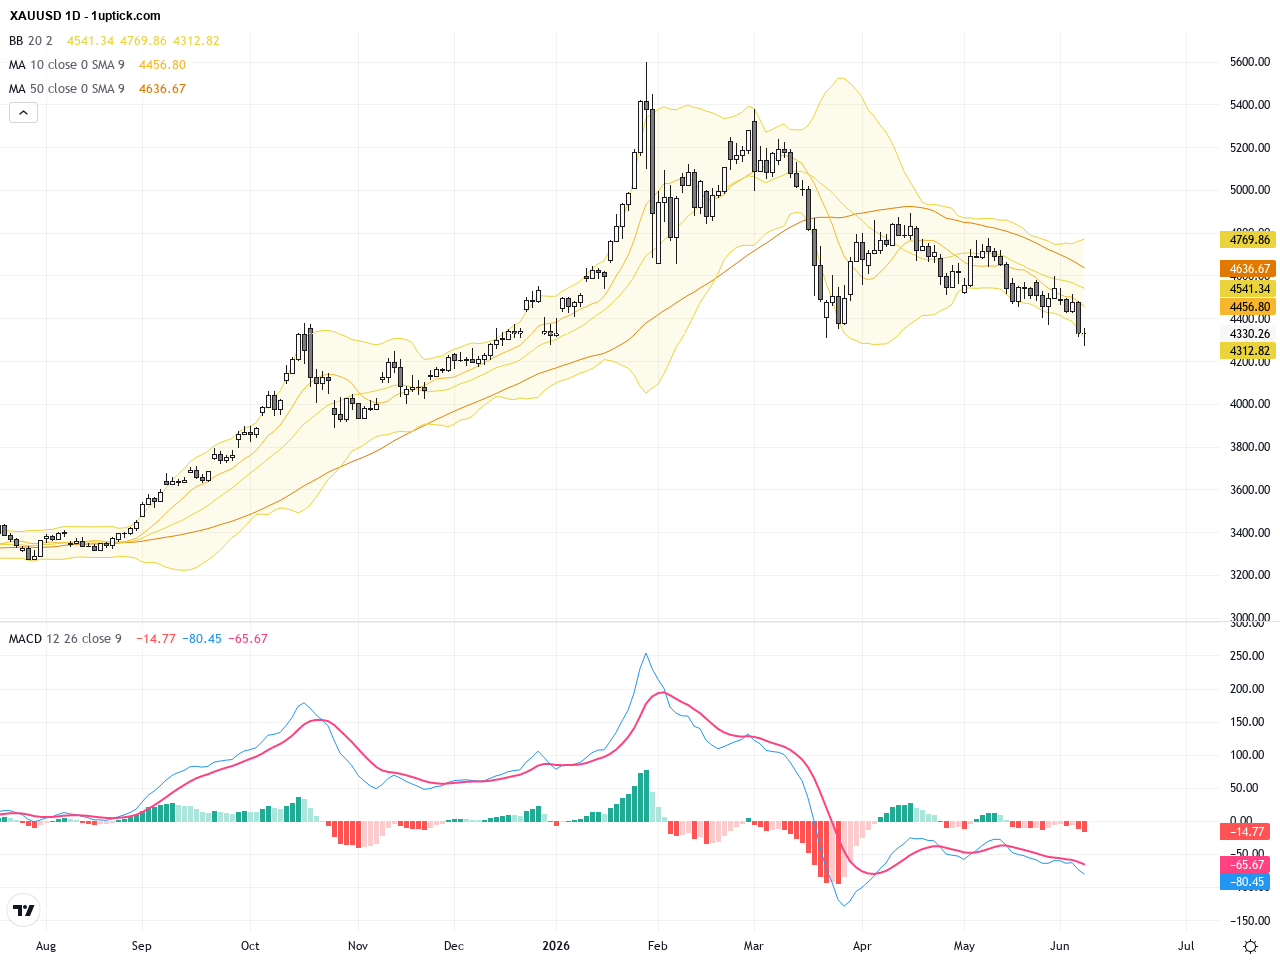
The daily chart shows XAUUSD declining steadily from the late May high near 4540 to the latest price around 4327, establishing a clear downtrend. Prices remain below the 200-day moving average with the Bollinger Bands widening downward, indicating increased volatility and a bearish bias. The MACD remains in negative territory, showing decreasing downside momentum but no confirmed buy signals yet, requiring further confirmation for a trend reversal.
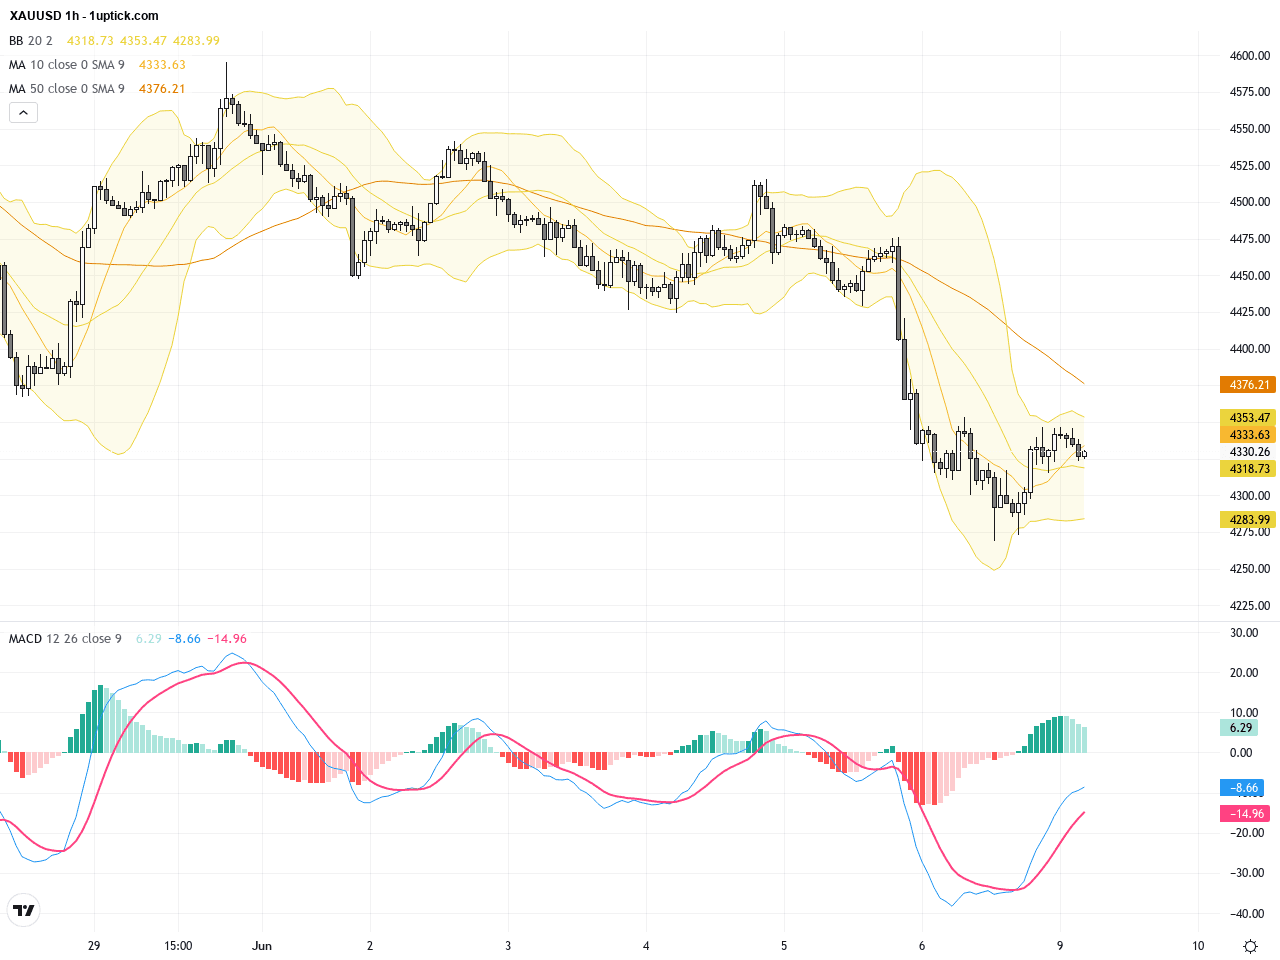
On the hourly chart covering the last 3-5 days, XAUUSD trades within a consolidation range between 4320 and 4350. Short-term moving averages (20 and 50) intertwine, reflecting indecision among traders. Bollinger Bands have contracted, suggesting abatement of immediate selling pressure. The MACD nears a bullish crossover, and a recent hammer candlestick pattern signals short-term support and potential for a rebound in the next 24 hours.
Technical Trend: The current trend is characterized as a cautiously bullish consolidation with short-term rebound potential.
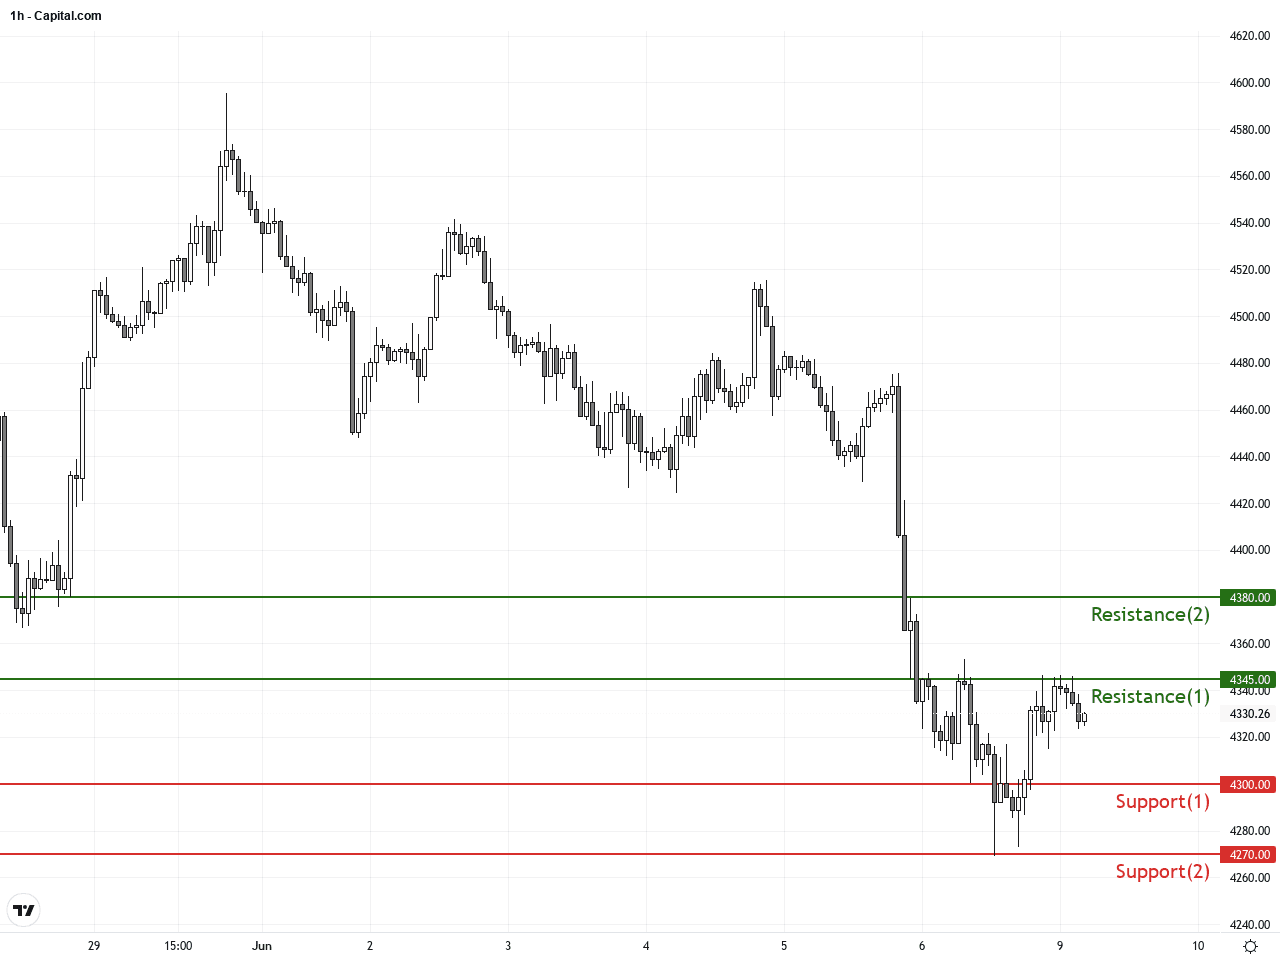
Technically, XAUUSD faces resistance near the convergence of the 1-month and 200-day moving averages around 4345. The short-term MACD bullish crossover and hammer candlestick suggest that selling pressure may temporarily ease. A breakout above 4345 could attract buyers seeking rebound momentum, while failure may lead the price to test support around 4300. Traders should closely monitor price consolidation and breakout direction, alongside evolving geopolitical risk dynamics influencing volatility.Today’s economic calendar presents notable data from Japan including Q1 GDP and current account figures. Japan’s annualized GDP growth of 1.8% came in below the 2.1% forecast, indicating a slowdown which can pressure the yen and indirectly affect USD and gold via market sentiment. However, no major US economic releases are scheduled today, implying limited immediate direct impact on XAUUSD price movements.
Resistance & Support
The above financial market data, quotes, charts, statistics, exchange rates, news, research, analysis, buy or sell ratings, financial education, and other information are for reference only. Before making any trades based on this information, you should consult independent professional advice to verify pricing data or obtain more detailed market information. 1uptick.com should not be regarded as soliciting any subscriber or visitor to execute any trade. You are solely responsible for all of your own trading decisions.