

 |
| Gold V.1.3.1 signal Telegram Channel (English) |

WTI Crude Oil: Middle East Tensions Propel Price Rebound Amid Key Technical Resistance, June 11, 2026
2026-06-11 @ 06:03
Over the past 24 to 48 hours, WTI crude oil prices have experienced significant volatility, reflecting the interplay of geopolitical tensions and market supply-demand dynamics. On June 10, WTI closed at $90.03, slightly lower than the previous day but still near recent highs.
The market reacted swiftly after former President Trump pledged immediate attacks on Iran, a hardline stance that spurred a quick rally in oil prices. On June 9, WTI touched a high of $91.87 as investors grew concerned about further instability in the Middle East. Gasoline prices followed suit, indicating broad energy market sensitivity to political risks.
Nevertheless, recent easing is apparent with some supply returning and expectations of moderated tensions, leading to a price dip in certain regions – for example, gasoline prices in Iowa fell by approximately 13 cents compared to last week. Overall, the WTI crude market is caught in tug-of-war between politically driven price surges and modest supply improvements.
For the typical investor, this market dynamic signals that oil prices remain directly vulnerable to international political developments, particularly military activities in the Middle East. With the US toughening its stance on Iran, short-term price fluctuations are likely to continue. Investors should closely monitor geopolitical news and supply fundamentals to adapt their strategies accordingly.

The WTI daily chart reveals a longer-term downward consolidation since early June, with prices retreating from highs above $96 towards the $90 level. Multiple attempts to break the $90 threshold have been met with resistance and subdued volume. The 50-day moving average is sloping downward, indicating mid-term bearish pressure. Bollinger Bands are contracting, reflecting subdued volatility. The MACD is in negative territory, confirming cautious bearish momentum on the daily timeframe.

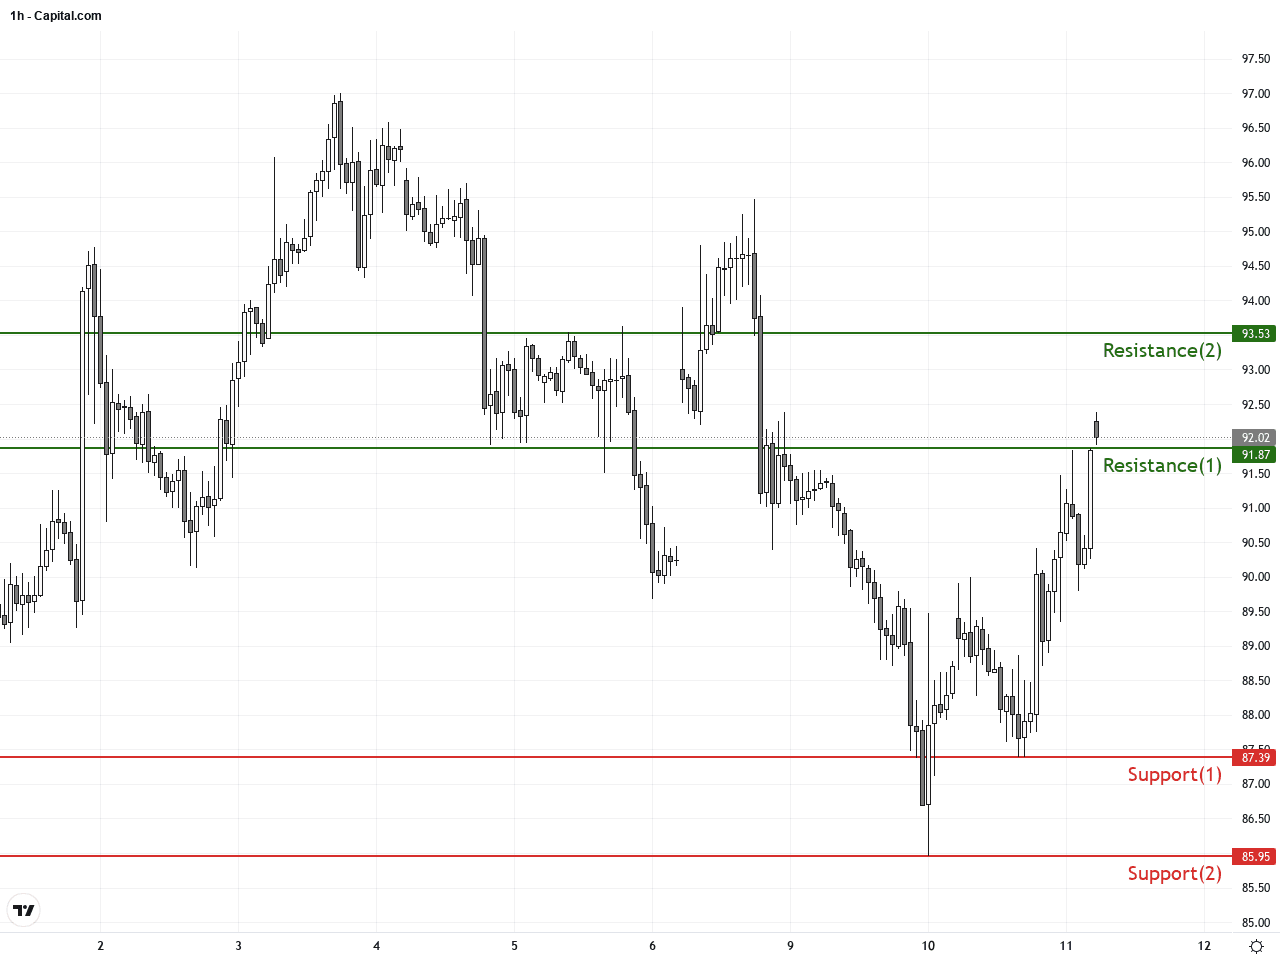
The WTI hourly chart shows intense price fluctuations over the past 3-5 days, forming a short-term bullish flag pattern, indicating positive market sentiment. Recent candles include a bullish engulfing pattern signaling increased buying interest. The MACD fast line has crossed above the slow line, confirming strengthening short-term momentum. The 20-hour moving average has crossed above the 50-hour moving average and the Bollinger Bands are expanding, suggesting potential continuation of the rebound.
Technical Trend: Consolidation approaching decisive breakout
Technically, WTI Crude Oil is testing the critical psychological resistance at $90. Daily MACD and moving averages indicate pressure with possible short-term consolidation. However, the hourly bullish flag and momentum signals suggest a potential near-term rally. A successful break above daily resistance levels would likely attract further buying interest and set the stage for a stronger uptrend.There are no significant or directly relevant economic events scheduled today that would impact WTI Crude Oil prices. Market participants should continue to monitor geopolitical developments and U.S. policy announcements as key catalysts for near-term price movements.
Resistance & Support
Run Live WTI Crude Oil Analysis
The above financial market data, quotes, charts, statistics, exchange rates, news, research, analysis, buy or sell ratings, financial education, and other information are for reference only. Before making any trades based on this information, you should consult independent professional advice to verify pricing data or obtain more detailed market information. 1uptick.com should not be regarded as soliciting any subscriber or visitor to execute any trade. You are solely responsible for all of your own trading decisions.