


 |
| Gold V.1.3.1 signal Telegram Channel (English) |

USDJPY: Strong Dollar Pressure Pushes Yen Lower Amid Rising Technical Momentum, June 12, 2026
2026-06-12 @ 11:01
Over the past 24 to 48 hours, the USD/JPY exchange rate showed notable volatility, slightly rising from yesterday’s closing price of 160.29, reflecting market reactions to recent geopolitical tensions and economic data. The US dollar gained support following the May Producer Price Index (PPI) surpassing expectations, pushing USD/JPY marginally higher towards an intraday high near 160.30. Rising US inflation pressures encouraged investors to favor the dollar, underpinning the currency pair.
Meanwhile, hopes for peace in the Middle East have dampened, providing some haven demand for the Japanese yen, though limited against the strength of the dollar. The Bank of Japan is expected to hike rates to 1.0% in June, complicating market sentiment around the yen and keeping the rate hovering near the 160 mark. Barclays has noted government intervention efforts aiming to keep USD/JPY stable around 160 to avoid excessive fluctuations.
For the average investor, this means the USD/JPY movement is a direct reflection of sensitivity to US inflation data and Japan’s monetary policy amidst ongoing geopolitical risks. The relatively stronger dollar has kept the pair elevated, and a possible BOJ rate hike could bolster the yen from its prolonged lows. Still, short-term volatility should be expected given geopolitical and intervention risks on the horizon.
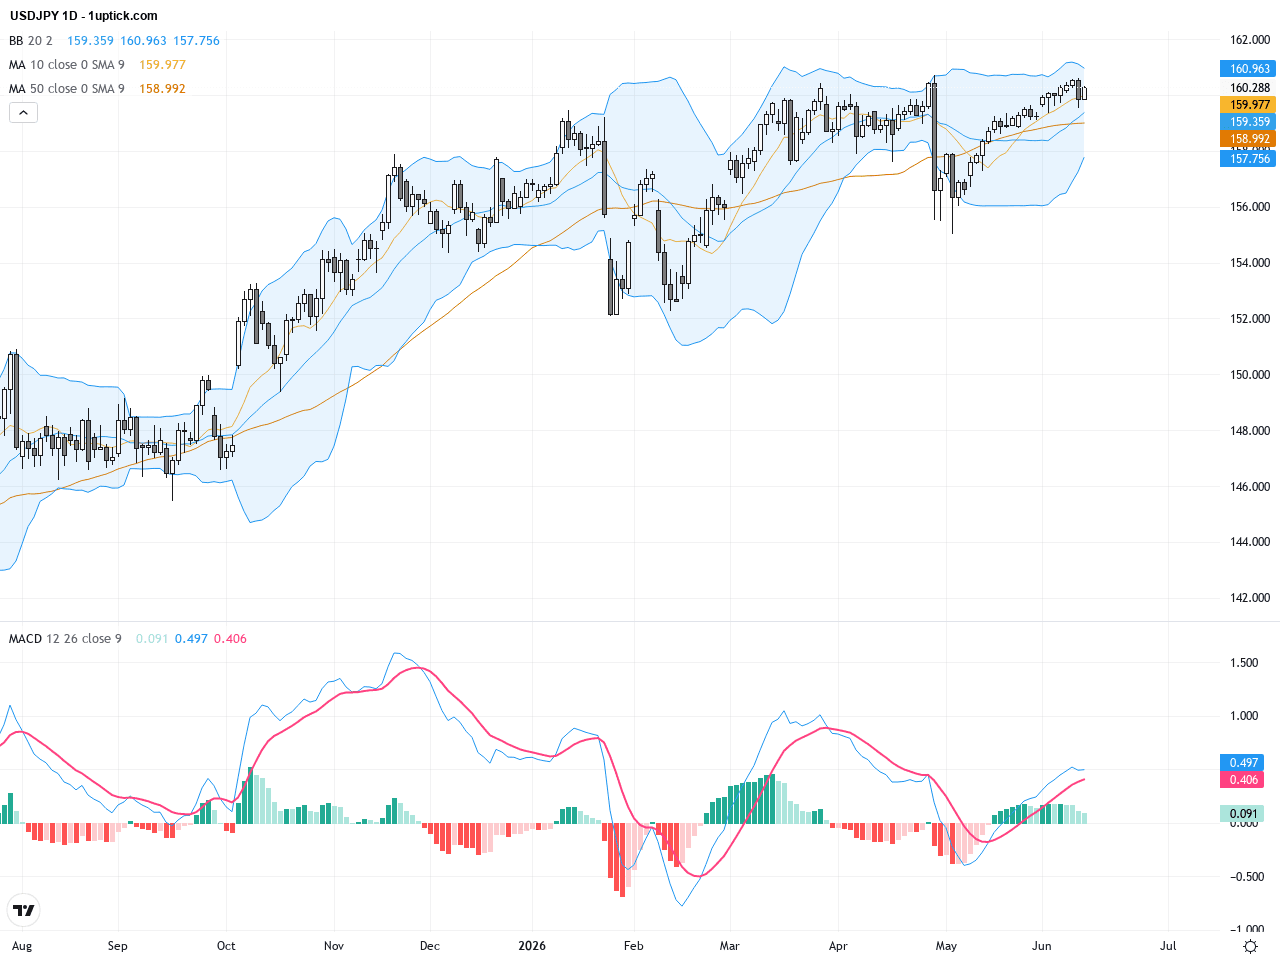
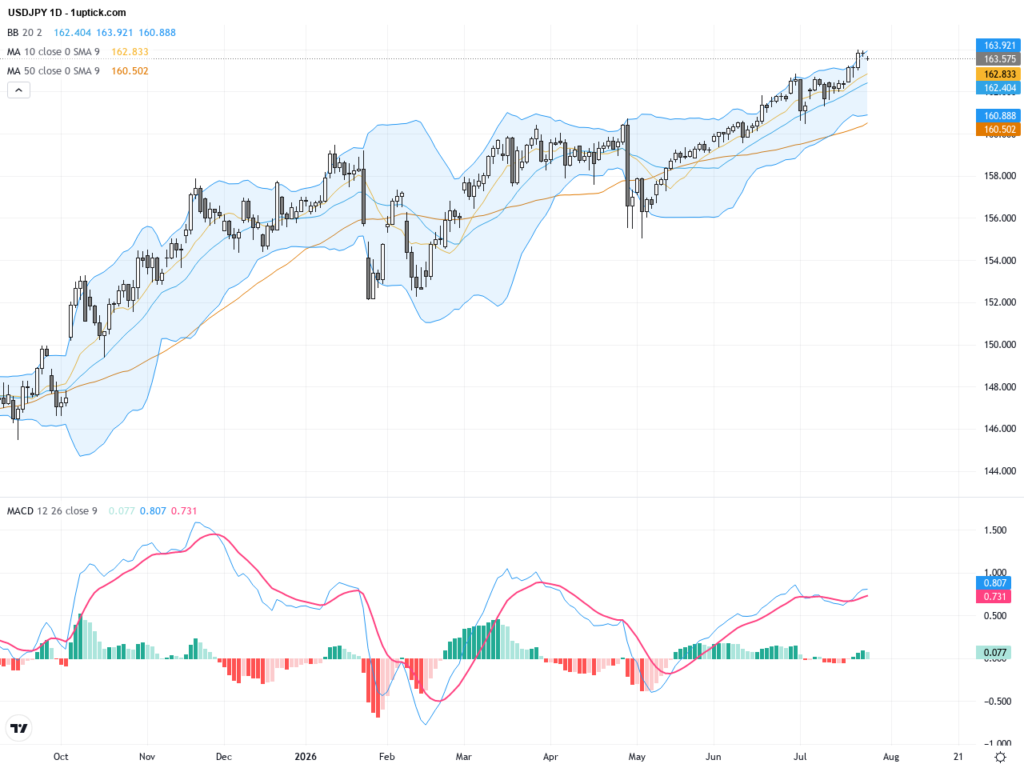
The daily chart reveals a clear uptrend for USDJPY, with prices consistently trading above the 50-day and 200-day moving averages, confirming medium to long term bullish momentum. Bollinger Bands are widening, indicating rising volatility, while the MACD line stays above its signal line with upward trajectory, signaling strengthening bullish momentum. The pair is approaching the yearly high near 160.70, facing key resistance yet maintaining overall upward pressure. This setup supports a robust bullish outlook supported by strong fundamental catalysts.

On the hourly timeframe, USDJPY has undergone short-term consolidation with a minor pullback over the last 3 to 5 days before a swift recovery. Price hovers around the 160 level interacting closely with the 20-hour moving average, indicating short-term sideways movement. The MACD has recently triggered a bullish crossover, with RSI in the 60-70 range, suggesting resilience but room for retracement. Bollinger Bands show contraction signaling an imminent breakout. A flag or rectangle consolidation pattern is forming, where a break higher should extend the bullish trend.
Technical Trend: Clearly bullish trend with strong upward momentum.
Technically, USDJPY is in a strong bullish trend with daily MACD rising and expanding Bollinger Bands indicating growing momentum. The recent hourly MACD bullish crossover and solid RSI levels show buying pressure remains intact. The formation of a flag consolidation signals a potential breakout to the upside. The pair’s close above the psychological 160 level reinforces the bullish bias. Traders should keep an eye on key economic data and geopolitical developments that may trigger swift price reactions.Today’s economic calendar highlights Japan’s April Industrial Production data release at 06:30 GMT+1. Market consensus forecasts a 0.8% month-over-month increase, which if confirmed, could strengthen the yen. U.S. releases at 16:00 include the University of Michigan Consumer Sentiment and Inflation Outlooks; stronger-than-expected readings would likely boost the dollar and favor USDJPY gains. Overall, no game-changing events are scheduled directly impacting USDJPY today, but investors should monitor these releases closely for short-term sentiment shifts.
Resistance & Support

The above financial market data, quotes, charts, statistics, exchange rates, news, research, analysis, buy or sell ratings, financial education, and other information are for reference only. Before making any trades based on this information, you should consult independent professional advice to verify pricing data or obtain more detailed market information. 1uptick.com should not be regarded as soliciting any subscriber or visitor to execute any trade. You are solely responsible for all of your own trading decisions.