


 |
| Gold V.1.3.1 signal Telegram Channel (English) |

USDJPY Breaks Key 160 Level: Critical Support and Resistance for Traders, June 15, 2026
2026-06-15 @ 11:01
Over the past 24 to 48 hours, the USD/JPY pair has remained steady, hovering around the 160 level and closing at approximately 160.14 yesterday, a slight decline of 0.04 points from the previous day. Market participants are focused on the upcoming Bank of Japan (BOJ) policy meeting next week, where a historic rate hike to 1.0% is expected — the first since the 1990s — reinforcing the recent gradual upward pressure on the yen against the dollar.
Simultaneously, geopolitical tensions in the Middle East continue to cast a shadow of uncertainty, lending safe-haven support to the yen, which helps the USD/JPY maintain its elevated range amid market fluctuations. The US Dollar Index (DXY) has seen little change recently as markets cautiously weigh the odds of a US-Iran peace deal, keeping investor sentiment guarded and indirectly influencing the dollar’s overall movement.
For the average investor, these dynamics illustrate how global macro uncertainties reverberate through currency markets. The BOJ’s tightening stance signals a policy shift in Japan’s economy, while geopolitical instability heightens safe-haven demand, combining to keep the USD/JPY exchange rate robust around the 160 mark. Investors should stay vigilant to upcoming policy announcements and geopolitical developments, as these could quickly shift market direction.

The daily chart illustrates USDJPY’s impressive climb from the year’s low near 142 to above 160, sustaining a strong uptrend. Both the 50-day and 200-day moving averages are aligned bullishly, and the price is riding near the upper Bollinger Band, indicating robust momentum. Although the MACD histogram is positive, its recent contraction suggests some short-term corrective risk. Key resistance stands near 161.60-161.95, where a breakout could confirm further upside potential.
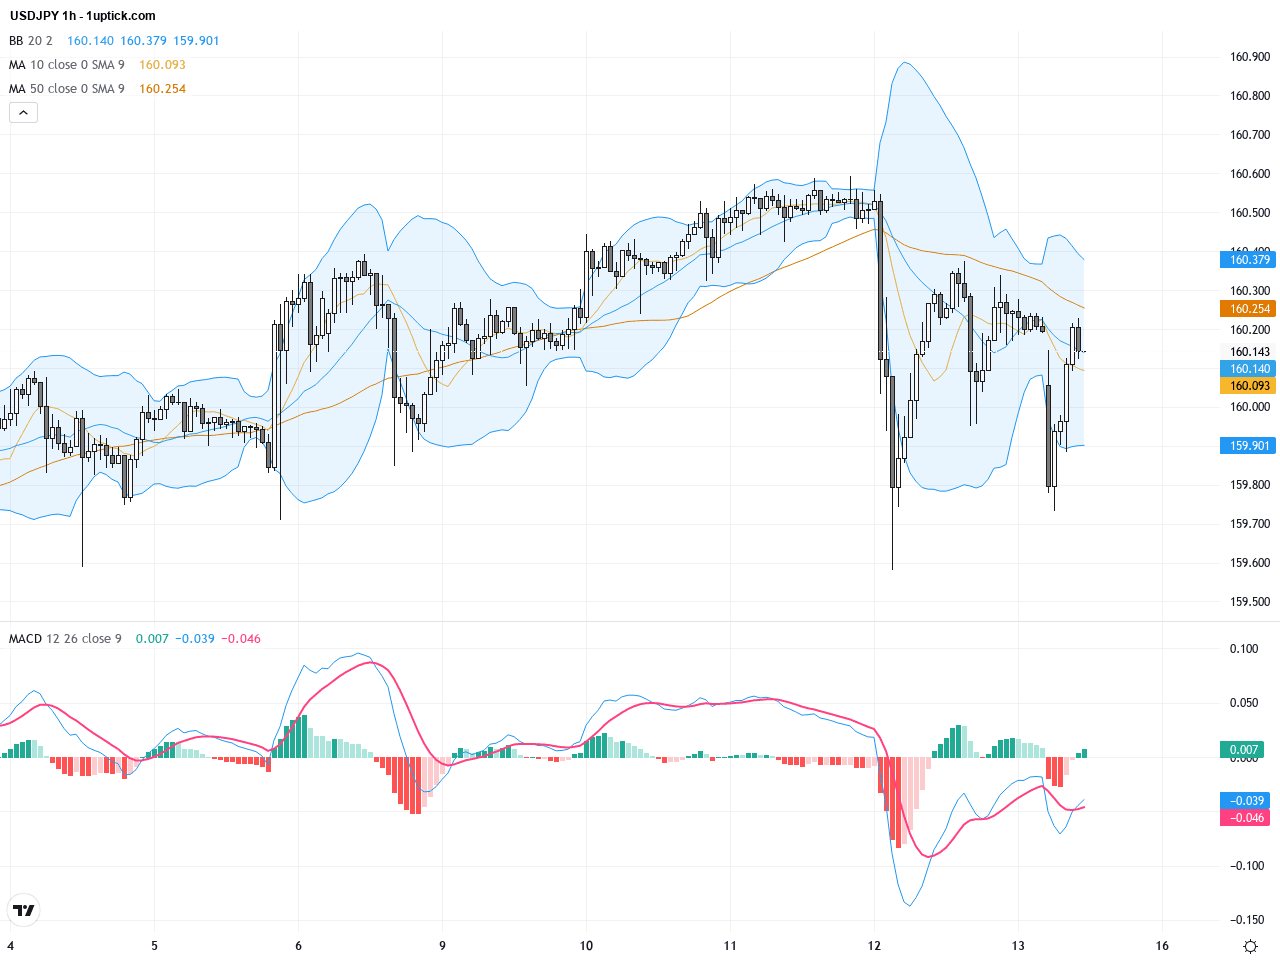
The hourly chart over the last 5 days shows USDJPY oscillating closely around 160, testing the middle Bollinger Band multiple times, reflecting balanced short-term supply and demand. The KDJ oscillator remains in a neutral band without extreme conditions, while MACD exhibits a subtle bullish crossover. A recent hammer candlestick with a long lower shadow suggests sellers are losing strength, potentially supporting a test of resistance levels within the next 24 hours.
Technical Trend: Current trend is cautiously bullish with short-term consolidation, showing potential for a breakout above the key resistance zone of 161, maintaining an overall strong upward trajectory.
Technically, USDJPY price action remains firm around the psychological 160 level. The contracting MACD histogram on the daily chart indicates waning bullish momentum, though the hourly chart’s bullish crossover and hammer formation signal short-term buying interest. Traders should watch MACD and Bollinger Bands for support-resistance reactions and anticipate volatility around the Bank of Japan’s policy announcement.Today’s GMT+1 economic calendar lacks significant or direct events impacting USDJPY. European data such as industrial production, trade balances, and inflation metrics are scheduled but are less impactful on USDJPY’s movement. The key upcoming event is the Bank of Japan’s interest rate decision next week, which will likely dominate the currency pair’s direction. Thus, today’s price action is expected to respond primarily to technical factors.
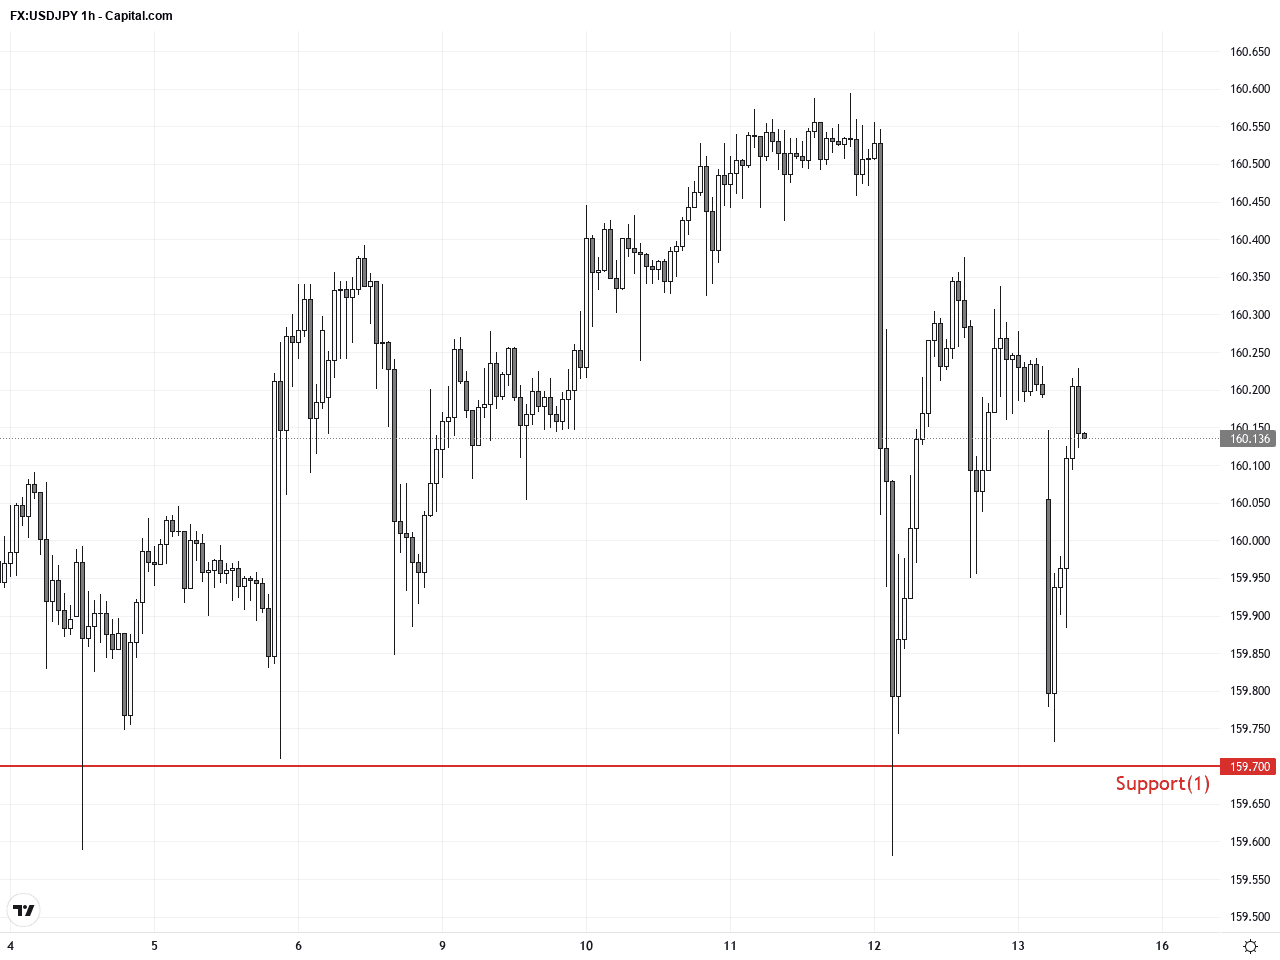
Resistance & Support
The above financial market data, quotes, charts, statistics, exchange rates, news, research, analysis, buy or sell ratings, financial education, and other information are for reference only. Before making any trades based on this information, you should consult independent professional advice to verify pricing data or obtain more detailed market information. 1uptick.com should not be regarded as soliciting any subscriber or visitor to execute any trade. You are solely responsible for all of your own trading decisions.