



 |
| Gold V.1.3.1 signal Telegram Channel (English) |

WTI Crude Oil: Navigating Key Support Amid Technical Downtrend and Geopolitical News, June 18, 2026
2026-06-18 @ 06:03
Over the past 24 to 48 hours, WTI Crude oil prices have experienced notable volatility, closing at $76.01 per barrel yesterday, marking a significant pullback from recent highs. The market has been influenced by multiple factors, especially the near-finalization of a US-Iran ceasefire deal, which has heightened expectations for resumed supply from the Middle East. Additionally, a recent International Energy Agency (IEA) report warned of a significant oil supply glut looming in 2027, intensifying concerns over mid-to-long-term oversupply.
With the ceasefire deal and potential reopening of the Strait of Hormuz, investors fear a swift return of volumes to the market, driving prices sharply lower, pushing WTI below the $80 level at one point. However, some senior portfolio managers maintain that $80 remains a solid floor price even after supply normalizes, reflecting the continued underlying tightness in oil fundamentals. This conflicting outlook has led to choppy price action over the last two days.
For average investors, this market shift highlights that oil prices are not only swayed by geopolitical developments but also by distorted global supply and demand expectations. While the ceasefire news is encouraging, it simultaneously pressures prices downward, signaling the need for caution given lingering Middle East uncertainties. The latest market news underlines that investors are closely monitoring progress on the Strait of Hormuz reopening and subsequent supply flows, which will remain the key drivers for WTI price direction going forward.

The daily chart reveals a clear downtrend over recent weeks with WTI Crude consistently declining from previous highs. The 20-day and 50-day moving averages have formed a bearish crossover, reflecting increased selling pressure over the medium term. Bollinger Bands show the price currently below the middle band but not yet breaking the lower band, suggesting room for a short-term rebound. The MACD resides in the negative territory but the histogram contraction indicates bearish momentum may be waning. Overall, the daily chart suggests a prevailing bearish environment with potential for technical bouncebacks.
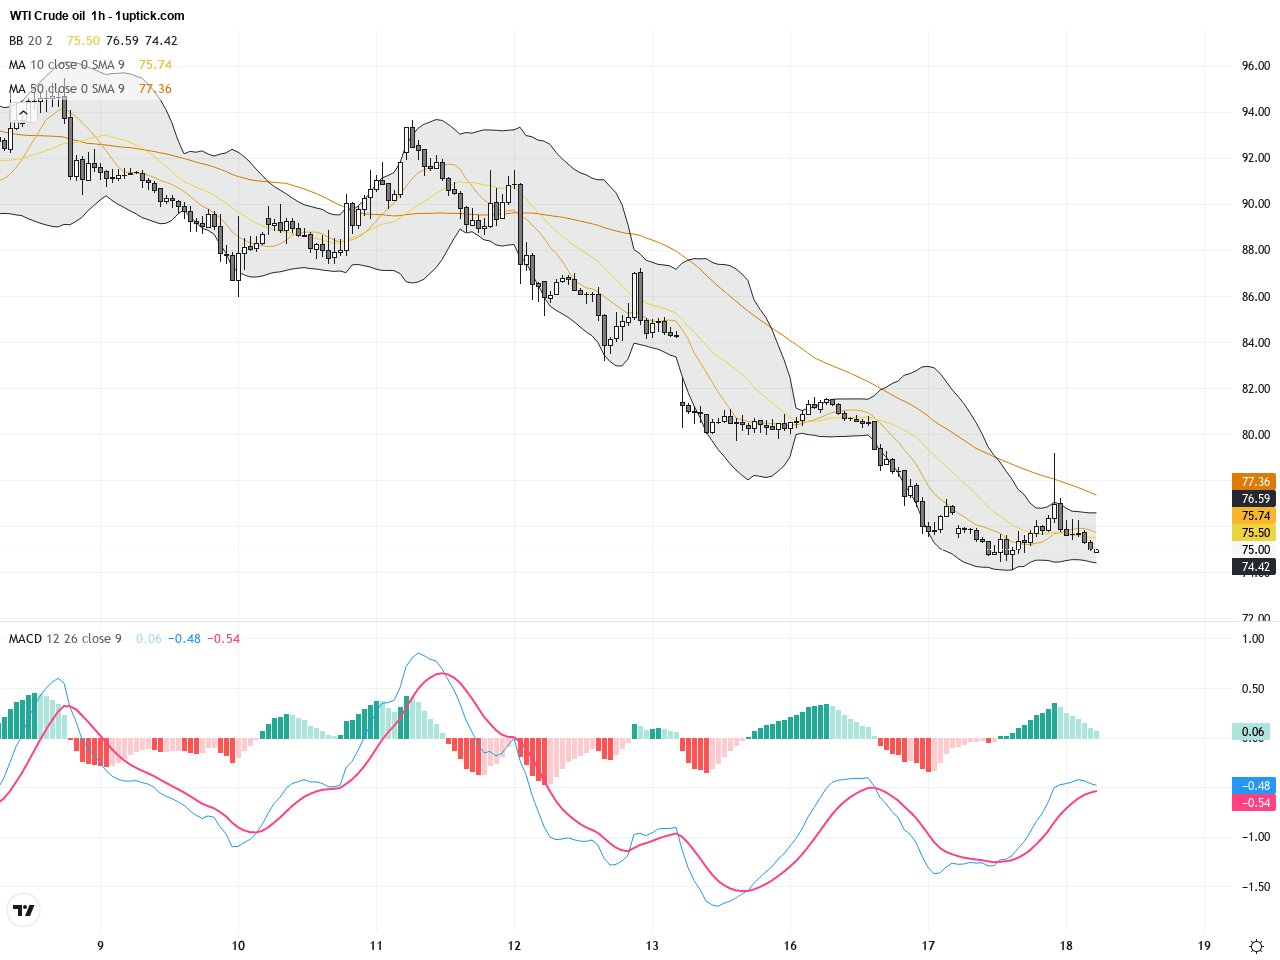
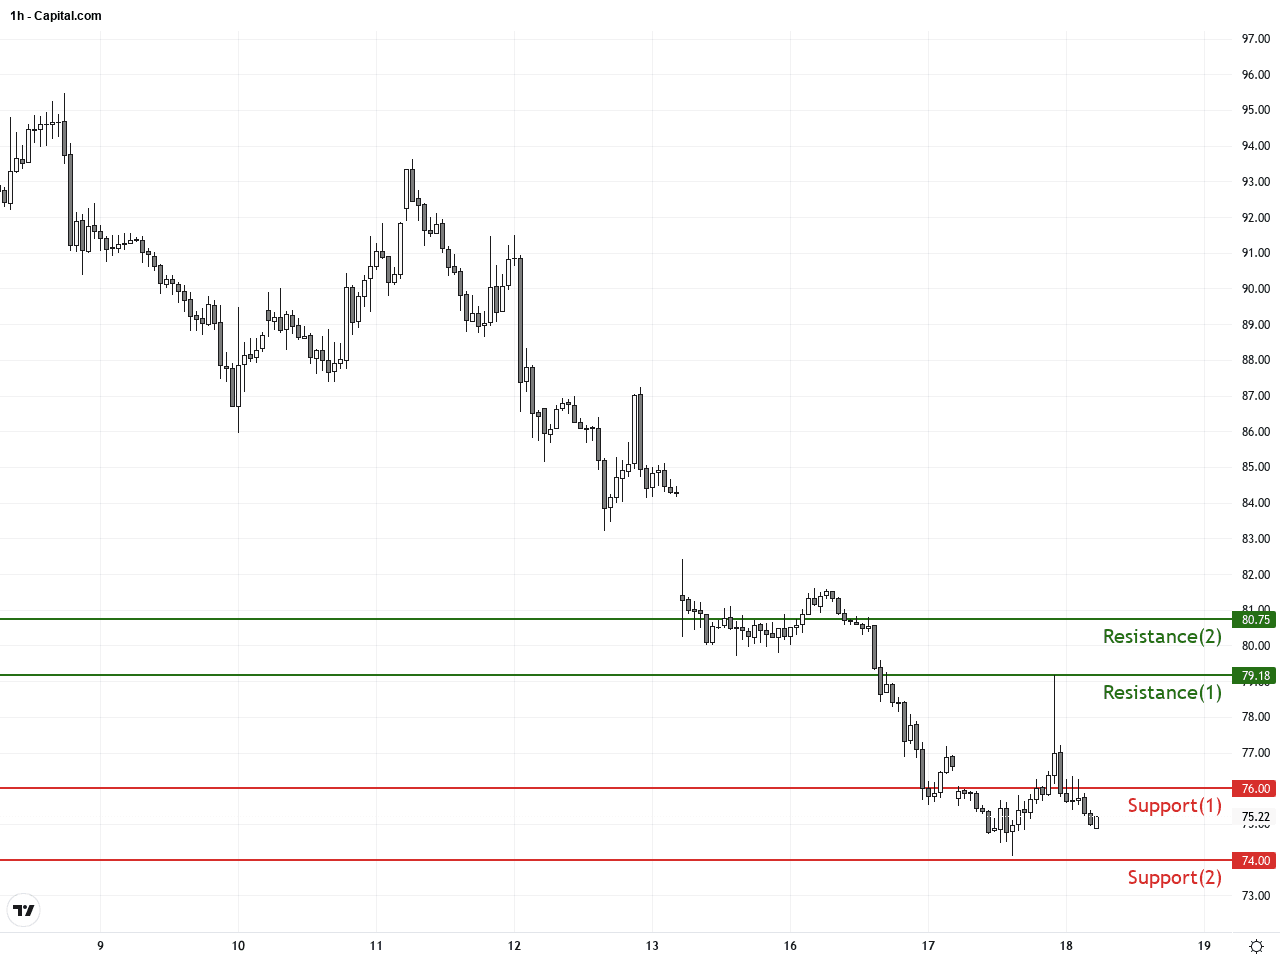
The hourly chart highlights intense price fluctuations over the past 3 to 5 days, with a trading range approximately between $75 and $79. Short-term moving averages such as the 5 and 10-period are frequently crossing, indicating consolidation. Bollinger Bands are narrowing, signaling an imminent volatility expansion. Recent price action near the $76 support level has formed a hammer candlestick, a sign that short-term buyers might be attempting to stabilize prices, though momentum confirmation is still pending.
Technical Trend: WTI Crude Oil is in a cautiously consolidating phase with a medium-term downtrend but a heightened probability of a near-term bounce, reflecting volatile sideways price action.
WTI currently demonstrates a medium-term bearish trend confirmed by the daily chart’s moving average death cross. However, the hammer pattern on the hourly chart and a contracting Bollinger Band hint at a near-term technical rebound. Geopolitical developments surrounding the Middle East and Strait of Hormuz are applying downward pressure due to supply concerns. MACD remains negative but shows signs of momentum slowing. Market participants should watch critical support levels and volume patterns closely for early signs of a trend reversal or continuation.There are no significant or directly relevant economic events scheduled today in the GMT+1 time zone that could impact WTI Crude Oil. Therefore, short-term price movements will likely be driven primarily by geopolitical developments and technical factors. Traders should maintain focus on supply-demand shifts and market news for cues.
Resistance & Support
Run Live WTI Crude Oil Analysis
The above financial market data, quotes, charts, statistics, exchange rates, news, research, analysis, buy or sell ratings, financial education, and other information are for reference only. Before making any trades based on this information, you should consult independent professional advice to verify pricing data or obtain more detailed market information. 1uptick.com should not be regarded as soliciting any subscriber or visitor to execute any trade. You are solely responsible for all of your own trading decisions.