

 |
| Gold V.1.3.1 signal Telegram Channel (English) |
USDCAD: Breaking 14-Month High Amid Mixed Dollar-Canadian Dollar Market Signals, June 25, 2026
2026-06-25 @ 13:01
Over the past 24-48 hours, the USD/CAD pair witnessed notable movements. Closing yesterday at 1.42302, it edged down slightly by 0.00016 or about 0.01% from the previous session. The recent volatility was primarily driven by interplay between the monetary policies and market sentiments of the US and Canada.
One key market news highlights that despite a hawkish Fed stance, the US dollar weakened, which unexpectedly strengthened the Canadian dollar. This dynamic reflects expectations for higher Canadian interest rates amid accelerating inflation in Canada. Although a dip in crude oil prices briefly pressured the CAD, the US economic data and Federal Reserve decisions remained dominant factors.
For the average investor, this means the Canadian dollar’s recent performance is not solely influenced by traditional energy markets but is supported by strong Canadian policy outlook and a generally softer US dollar. The USD/CAD fluctuations are a reminder to watch the bilateral interest rate differentials and geopolitical considerations closely, as US-Canada economic policy direction will continue to shape the pair’s trajectory.

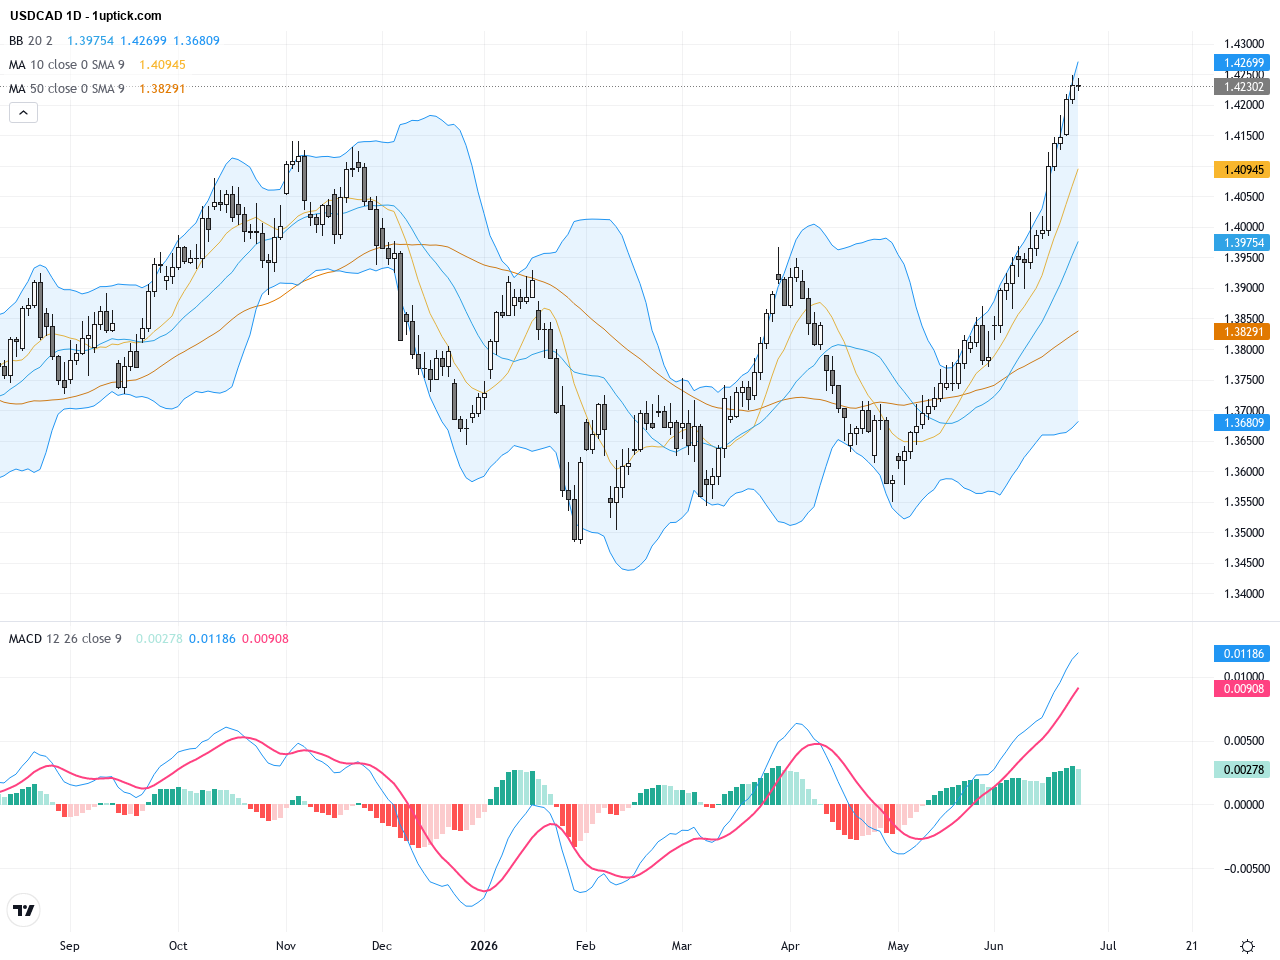
The daily chart reveals a clear uptrend for USDCAD that began late May, culminating this week near the 14-month peak. The 20-day and 50-day moving averages show a bullish alignment, and price action has mostly thrived near the upper Bollinger Band, signaling strength. However, the MACD shows waning bullish momentum, indicative of a possible consolidation or pullback soon. Price range contraction suggests a forming triangle pattern, hinting at an imminent directional breakout.
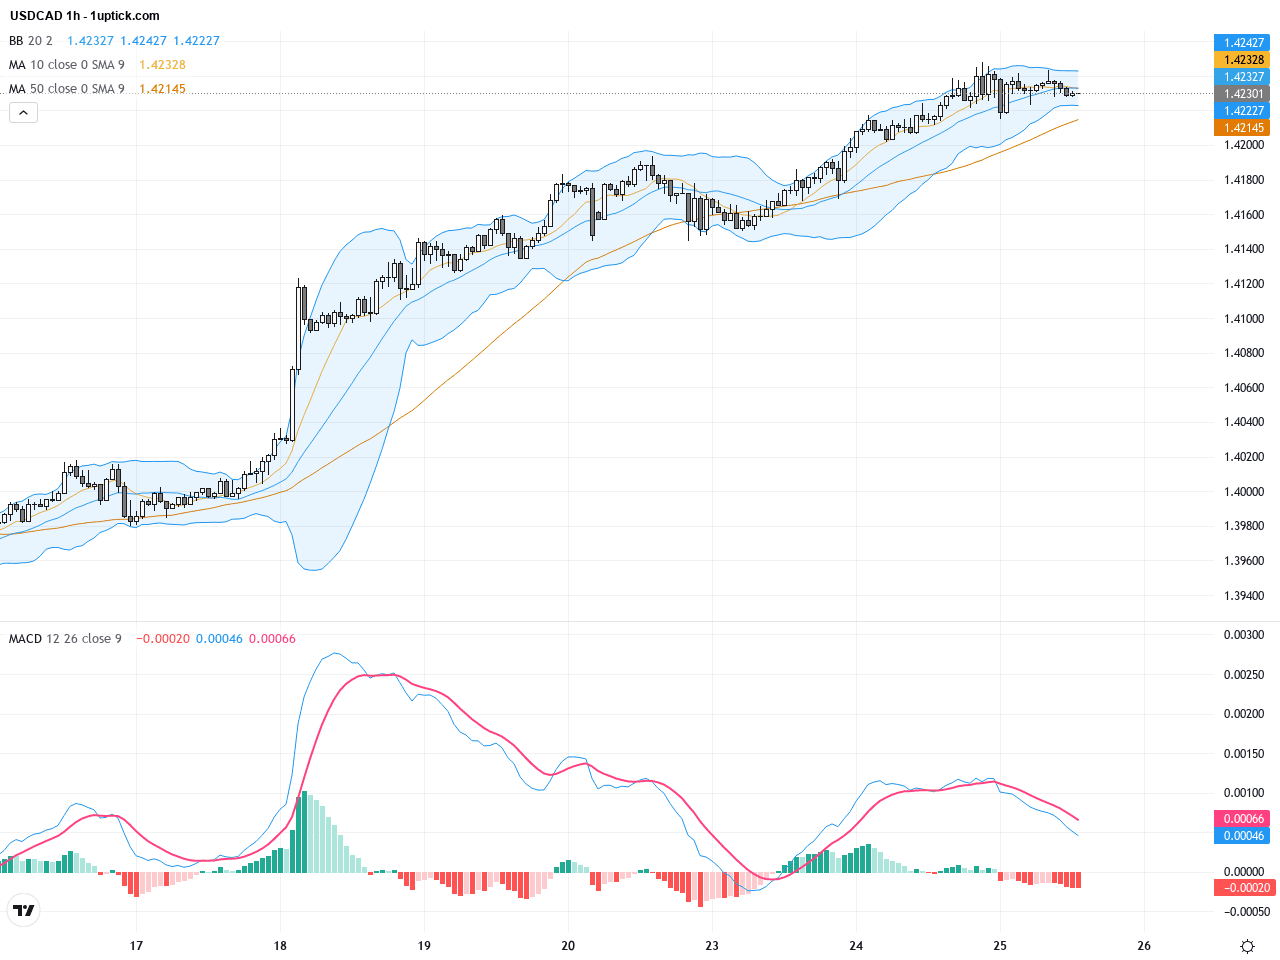
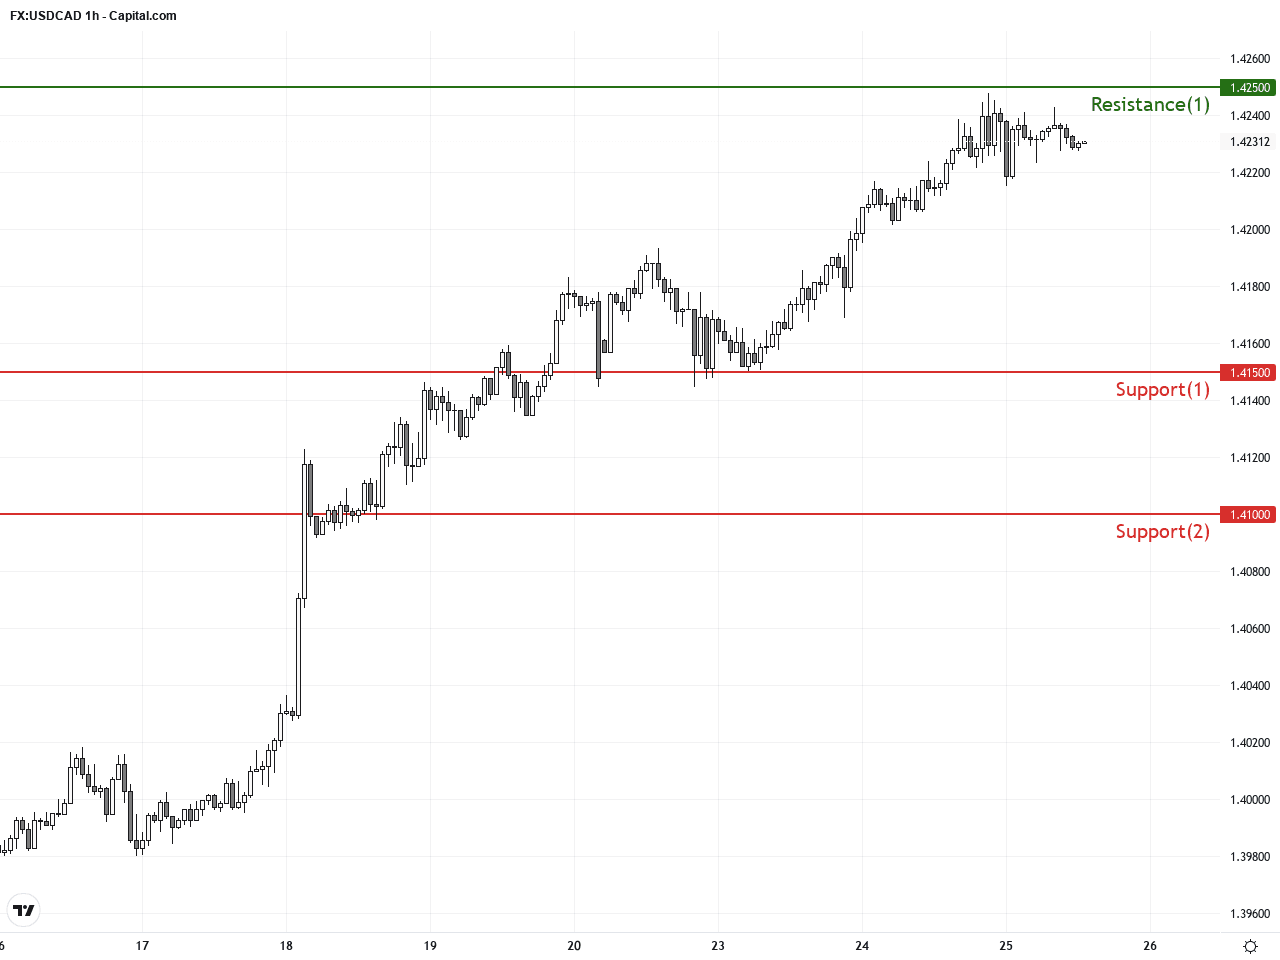
On the hourly chart over the past 3-5 days, USDCAD has been consolidating near resistance between 1.4230 and 1.4245. Prices hover near the upper Bollinger Band, and the short-term 20 and 50 moving averages are converging with a slight bullish bias. Meanwhile, MACD histogram shrinking toward zero and RSI approaching overbought territory suggest pressure for a short-term correction. The recent doji candlestick with a long upper wick signals market indecision.
Technical Trend: The overall trend is cautiously bullish, blending strong daily momentum with short-term indications of a potential pause or consolidation.
The dominant technical signal is the triangle pattern forming on the daily chart, suggesting an approaching decisive move. Meanwhile, the hourly chart’s overbought RSI and weakening MACD momentum point toward potential short-term pullback or consolidation. A clear break above resistance at 1.4250 could ignite renewed bullish momentum, while a drop below support at 1.4150 may signal a corrective phase. Traders should monitor volume and incoming economic data closely to confirm direction.Today’s economic calendar includes several global data releases, but the key US figures at 14:30 GMT+1 — Personal Consumption Expenditures (PCE) and final GDP — will have the most direct impact on USDCAD. Stronger-than-expected data would support the US dollar, likely pushing USDCAD higher; weaker data would favor the Canadian dollar and could trigger a pullback. No major Canadian economic releases are scheduled for today, focusing attention on US indicators.
Resistance & Support
The above financial market data, quotes, charts, statistics, exchange rates, news, research, analysis, buy or sell ratings, financial education, and other information are for reference only. Before making any trades based on this information, you should consult independent professional advice to verify pricing data or obtain more detailed market information. 1uptick.com should not be regarded as soliciting any subscriber or visitor to execute any trade. You are solely responsible for all of your own trading decisions.